| Participants | Participant-days | One-minute real observations | |
|---|---|---|---|
| participant roster | |||
| Available normalized participant metadata | 191 | Not applicable | Not applicable |
| near_eye | |||
| At least 80% complete before all-zero screen | Not applicable | 818 | Not applicable |
| Exact all-zero days excluded | Not applicable | 2 | Not applicable |
| Main dataset after all-zero screen | 141 | 816 | 1,175,160 |
| chest | |||
| At least 80% complete before all-zero screen | Not applicable | 905 | Not applicable |
| Exact all-zero days excluded | Not applicable | 3 | Not applicable |
| Main dataset after all-zero screen | 154 | 902 | 1,298,880 |
| paired | |||
| Paired main subset | 112 | 643 | Not applicable |
Supplementary Information
The health-relevant architecture of the everyday light exposome
The manuscript places these figures and tables in context. The analysis pages show how each display is produced.
Supplementary materials
Supplementary Methods: Preregistration deviations is supplied as a separate Word document (preregistration-deviations.docx). It describes all departures from the registered plan and the associated qualifications.
Download Supplementary Methods: Preregistration deviations, or read the deviations online.
Near-eye and complementary chest measurements remain separate sensor-position estimands. Common-sample analyses use the same participants and participant-days at both positions and fit the positions separately. They do not pool positions, test equivalence, or establish a universal correction. Detailed model checks, sensitivities, exact formulas, and package versions are documented in the analysis pages. The project repository provides the data, code and reproduction instructions.
Supplementary figures
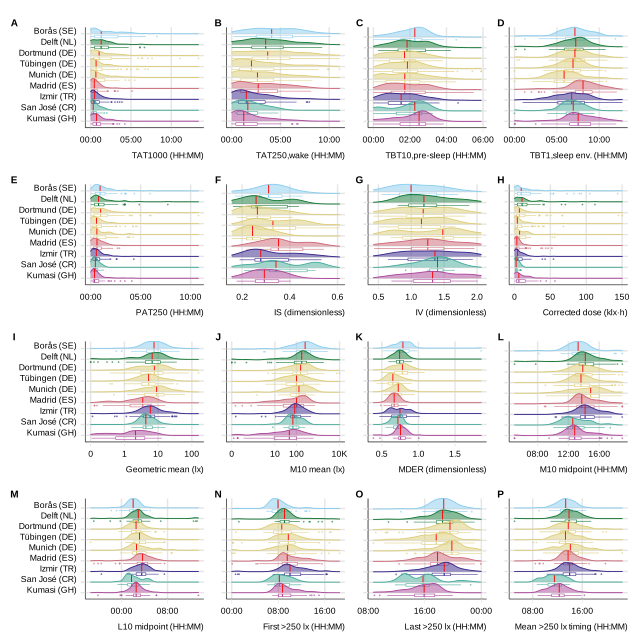
Supplementary Figure S1. Near-eye metric distributions
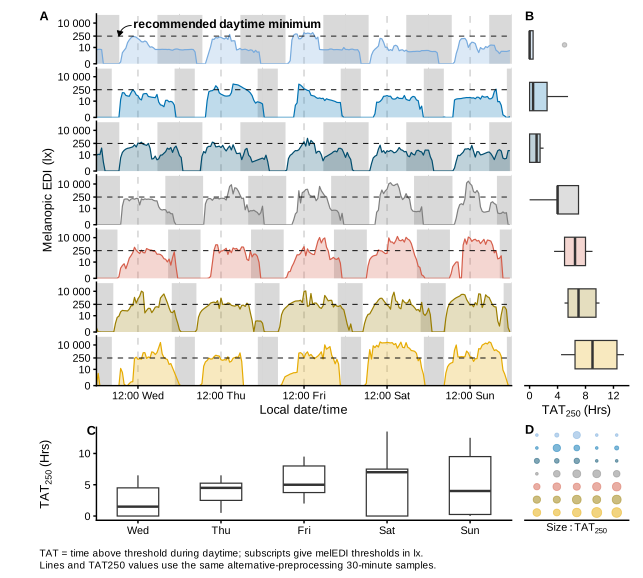
Supplementary Figure S2. Worked metric derivation
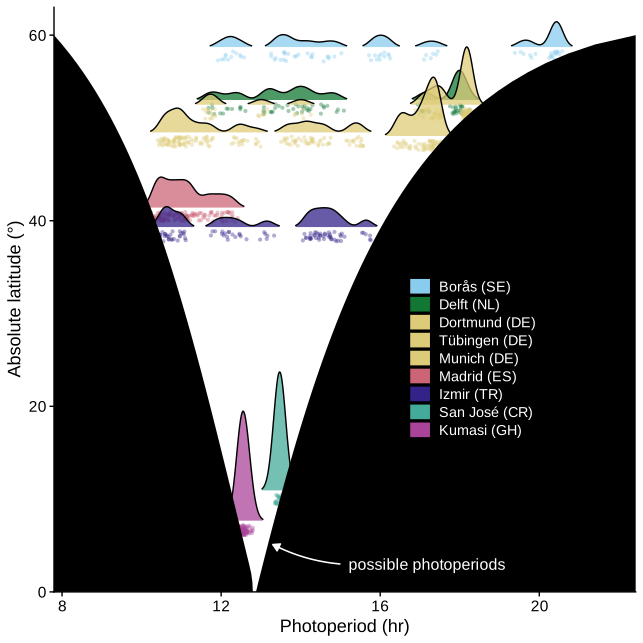
Supplementary Figure S3. Latitude and civil-photoperiod measurement range
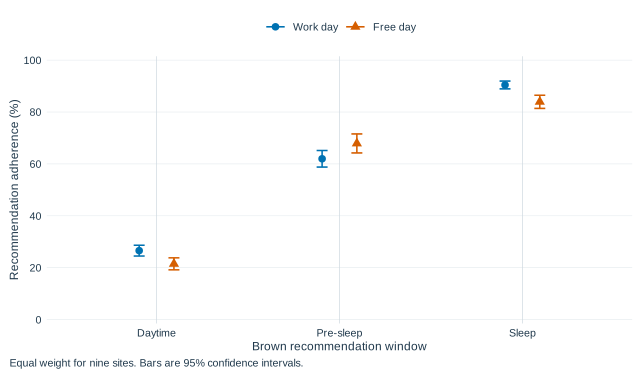
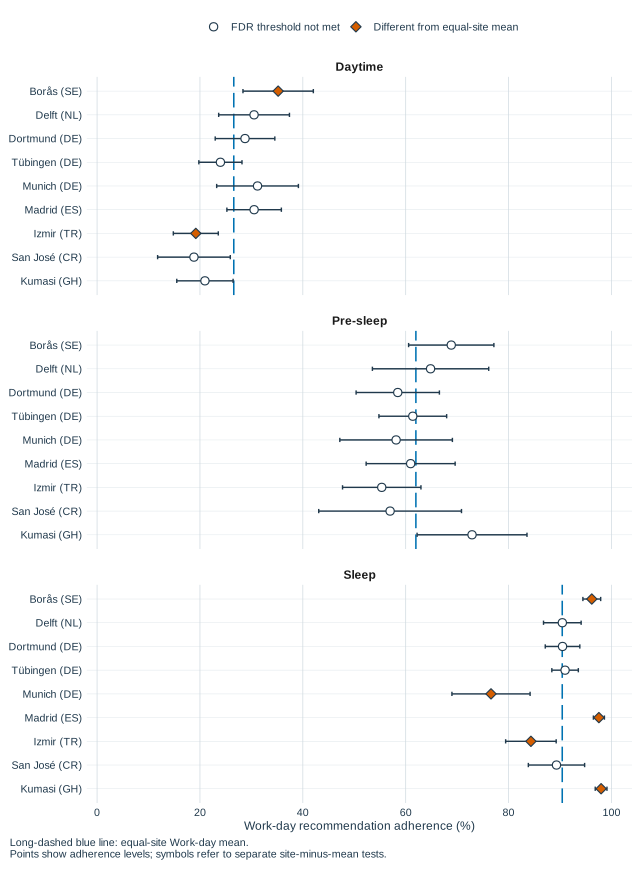
Supplementary Figure S4. Site-average recommendation adherence
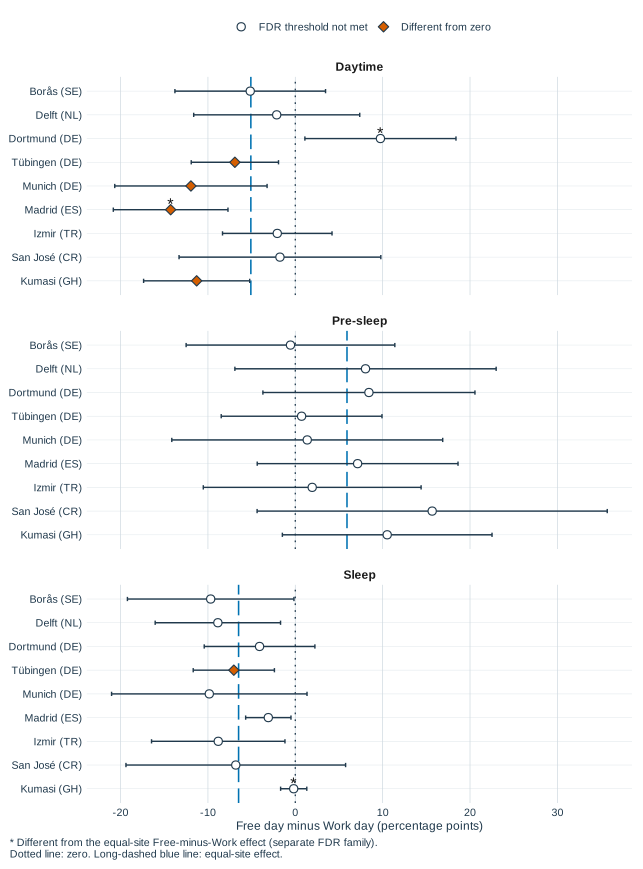
Supplementary Figure S5. Site-specific adherence and day-type differences
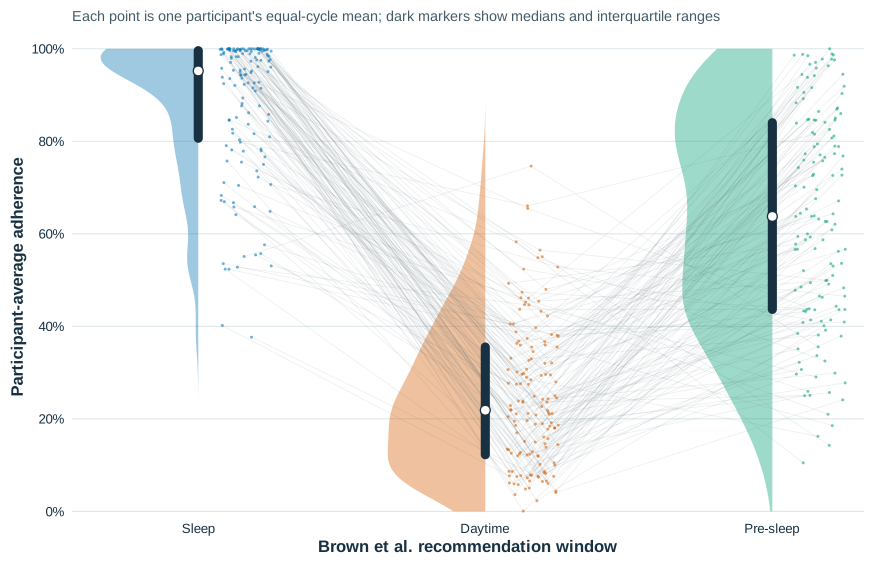
Supplementary Figure S6. Anonymous participant recommendation-adherence profiles
Supplementary Figure S7. Geographic and civil-photoperiod support
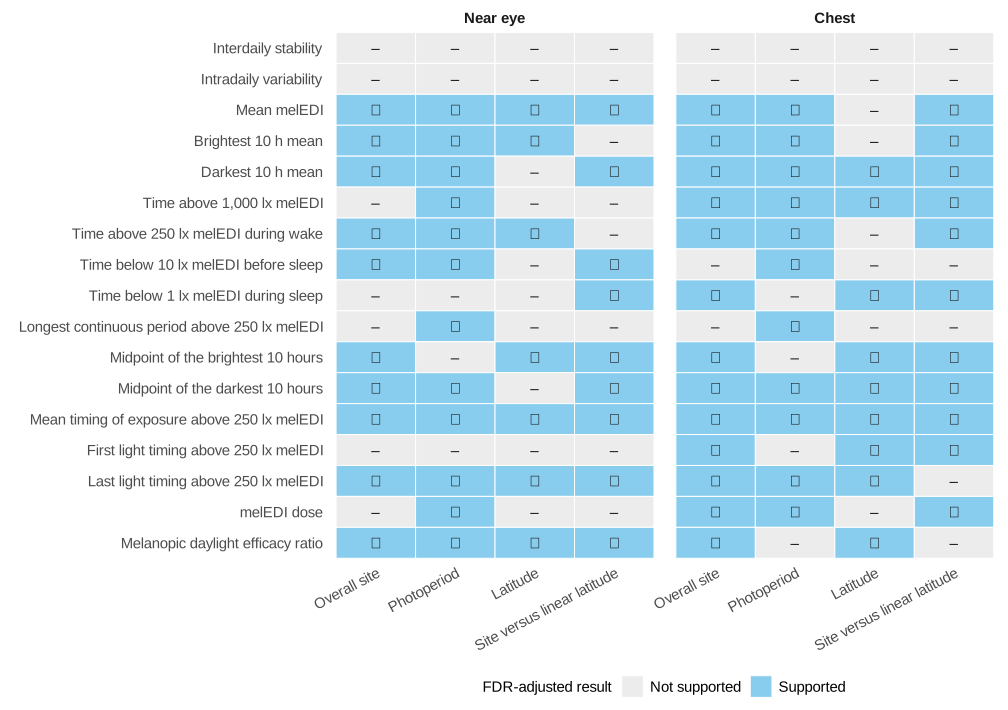
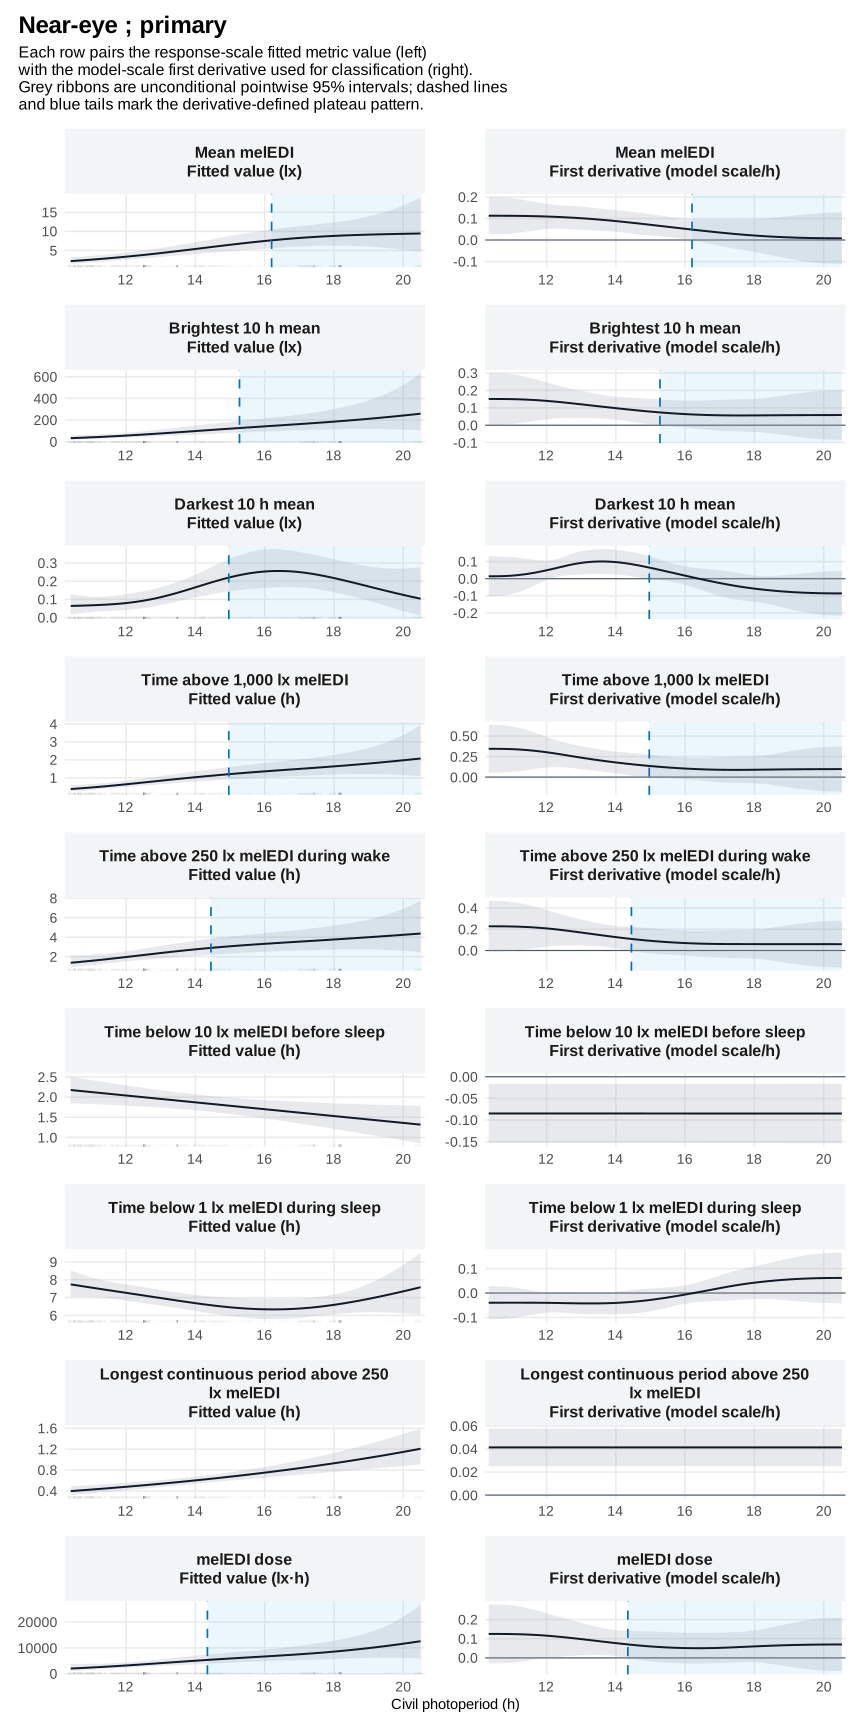
Supplementary Figure S8. Nonlinear civil-photoperiod associations and fitted slopes
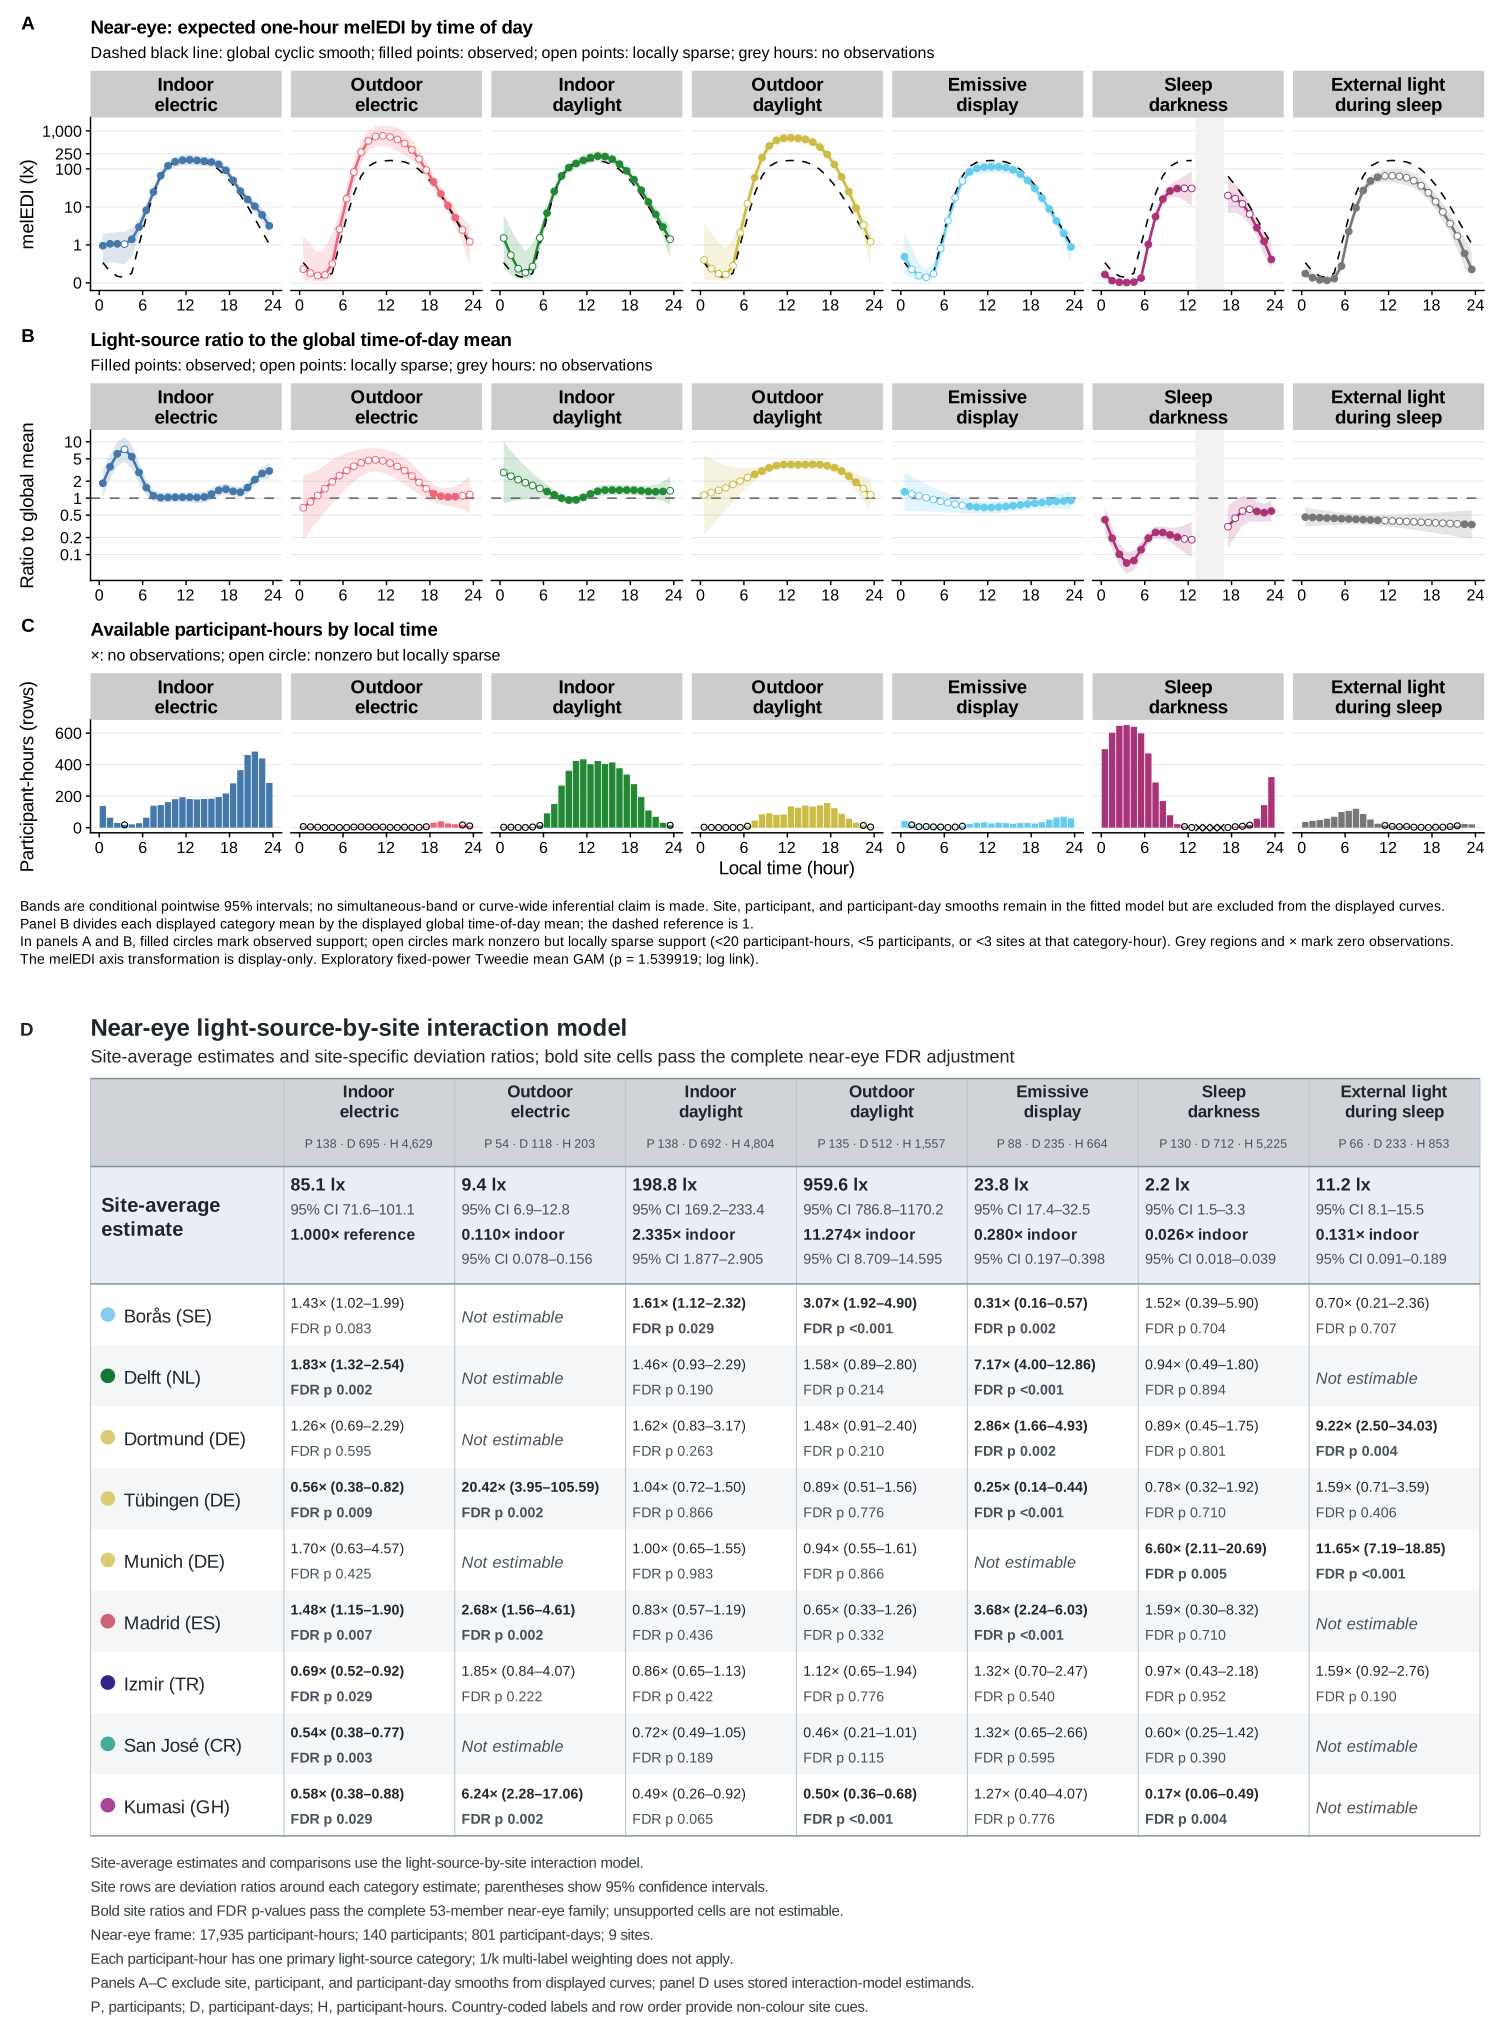
Supplementary Figure S9. Light-source category and local-clock pattern of near-eye melanopic EDI
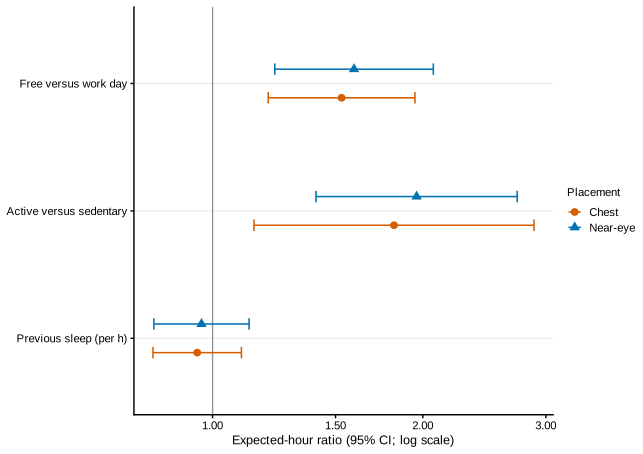
Supplementary Figure S10. Paired sensor-position hourly associations
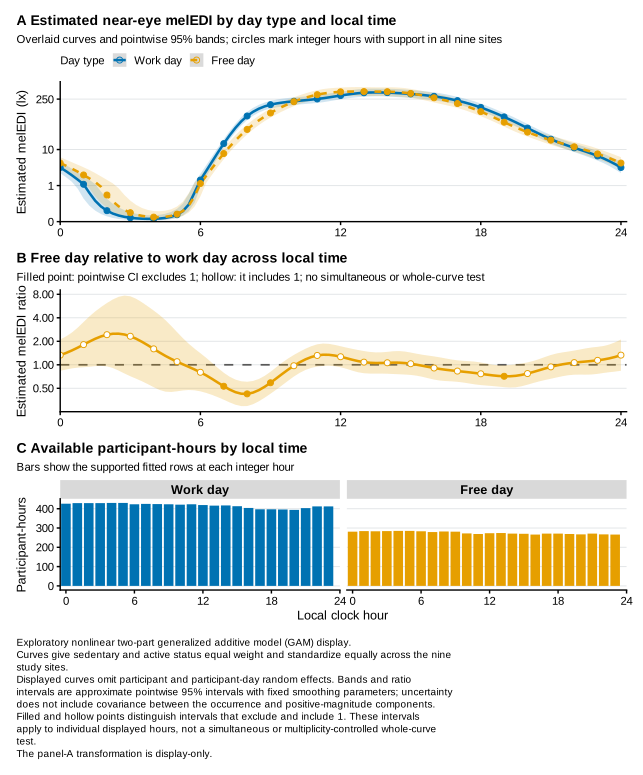
Supplementary Figure S11. Free-versus-Work hourly timing
Supplementary Figure S12. Active-versus-Sedentary hourly timing
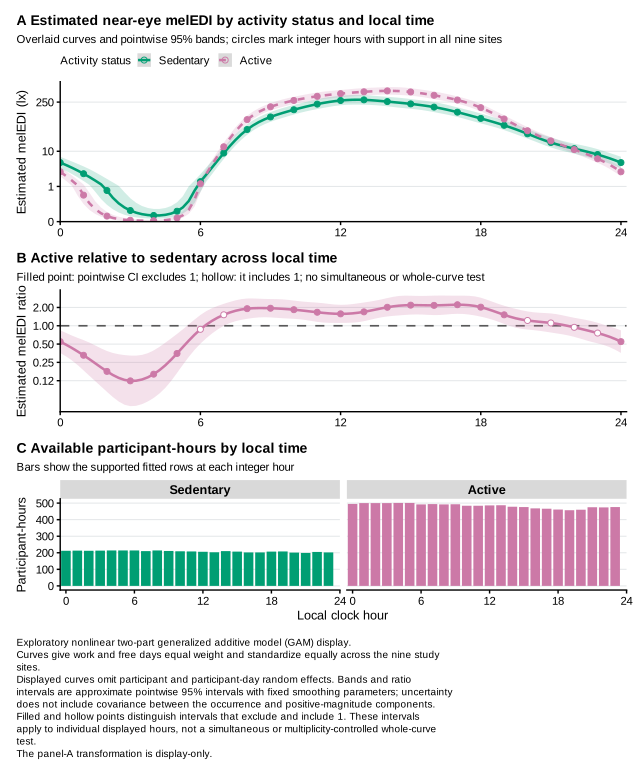
Supplementary Figure S13. Site-specific hourly routine associations
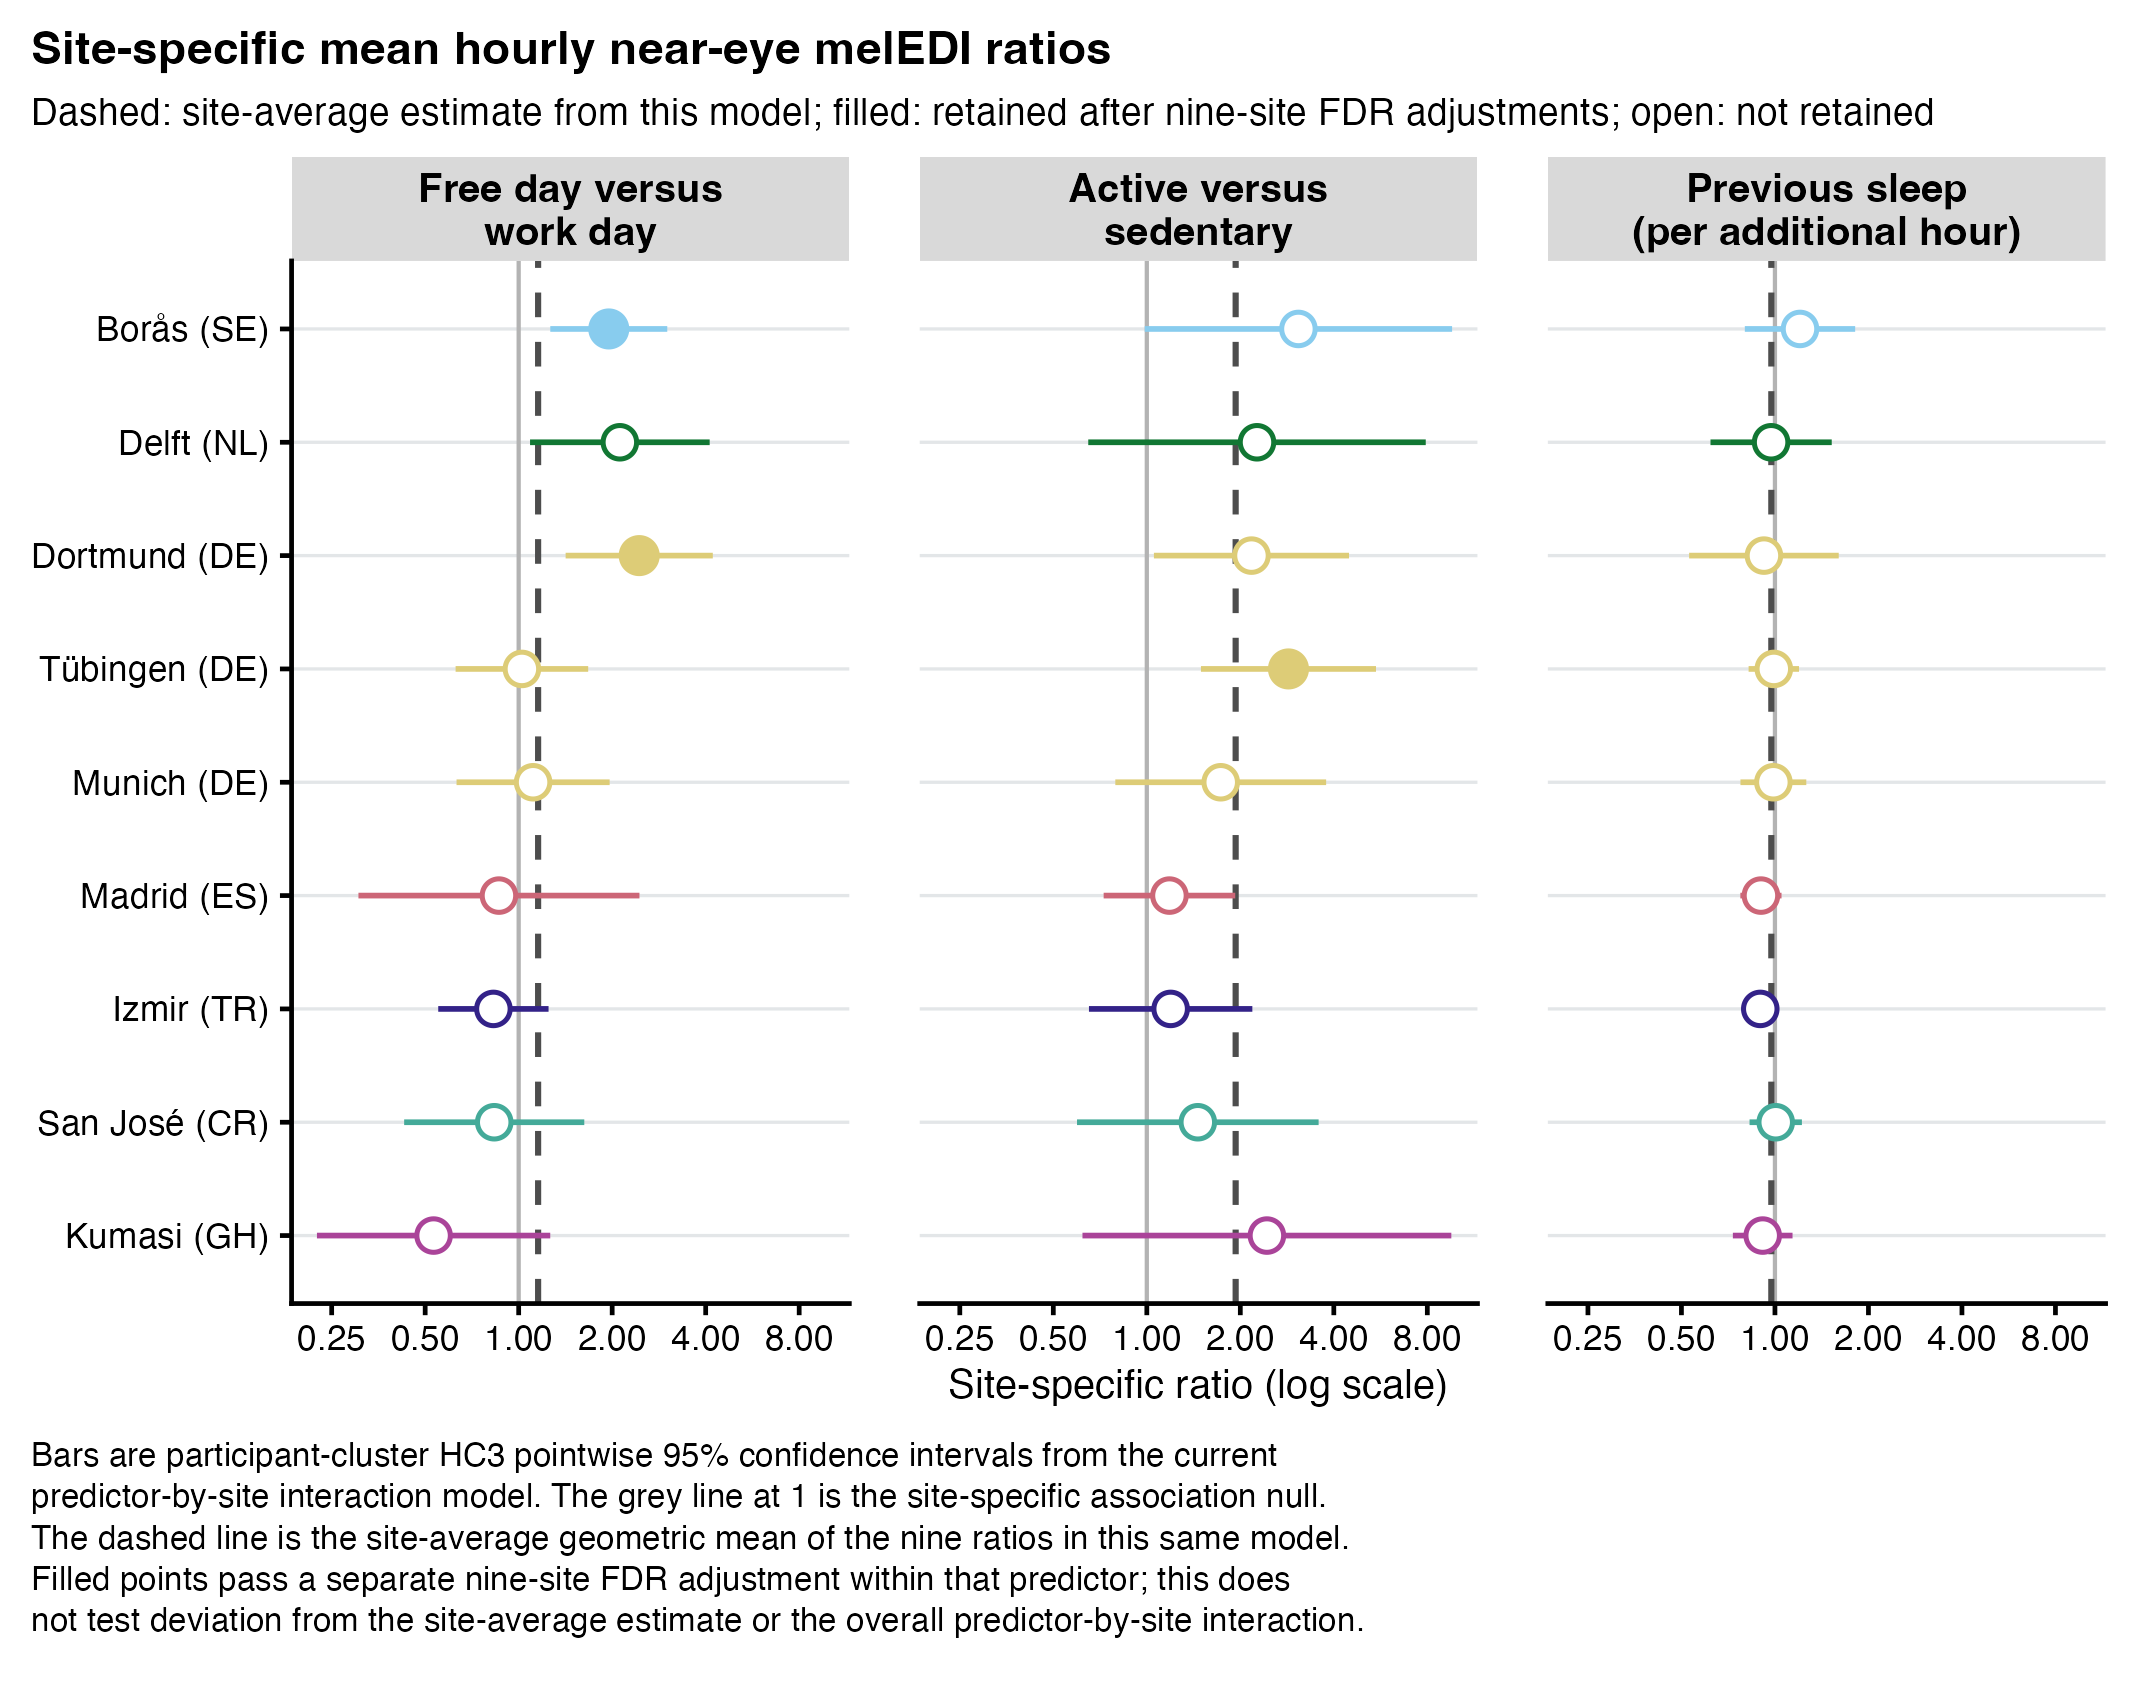
Supplementary Figure S14. Light-exposure behaviour and awareness
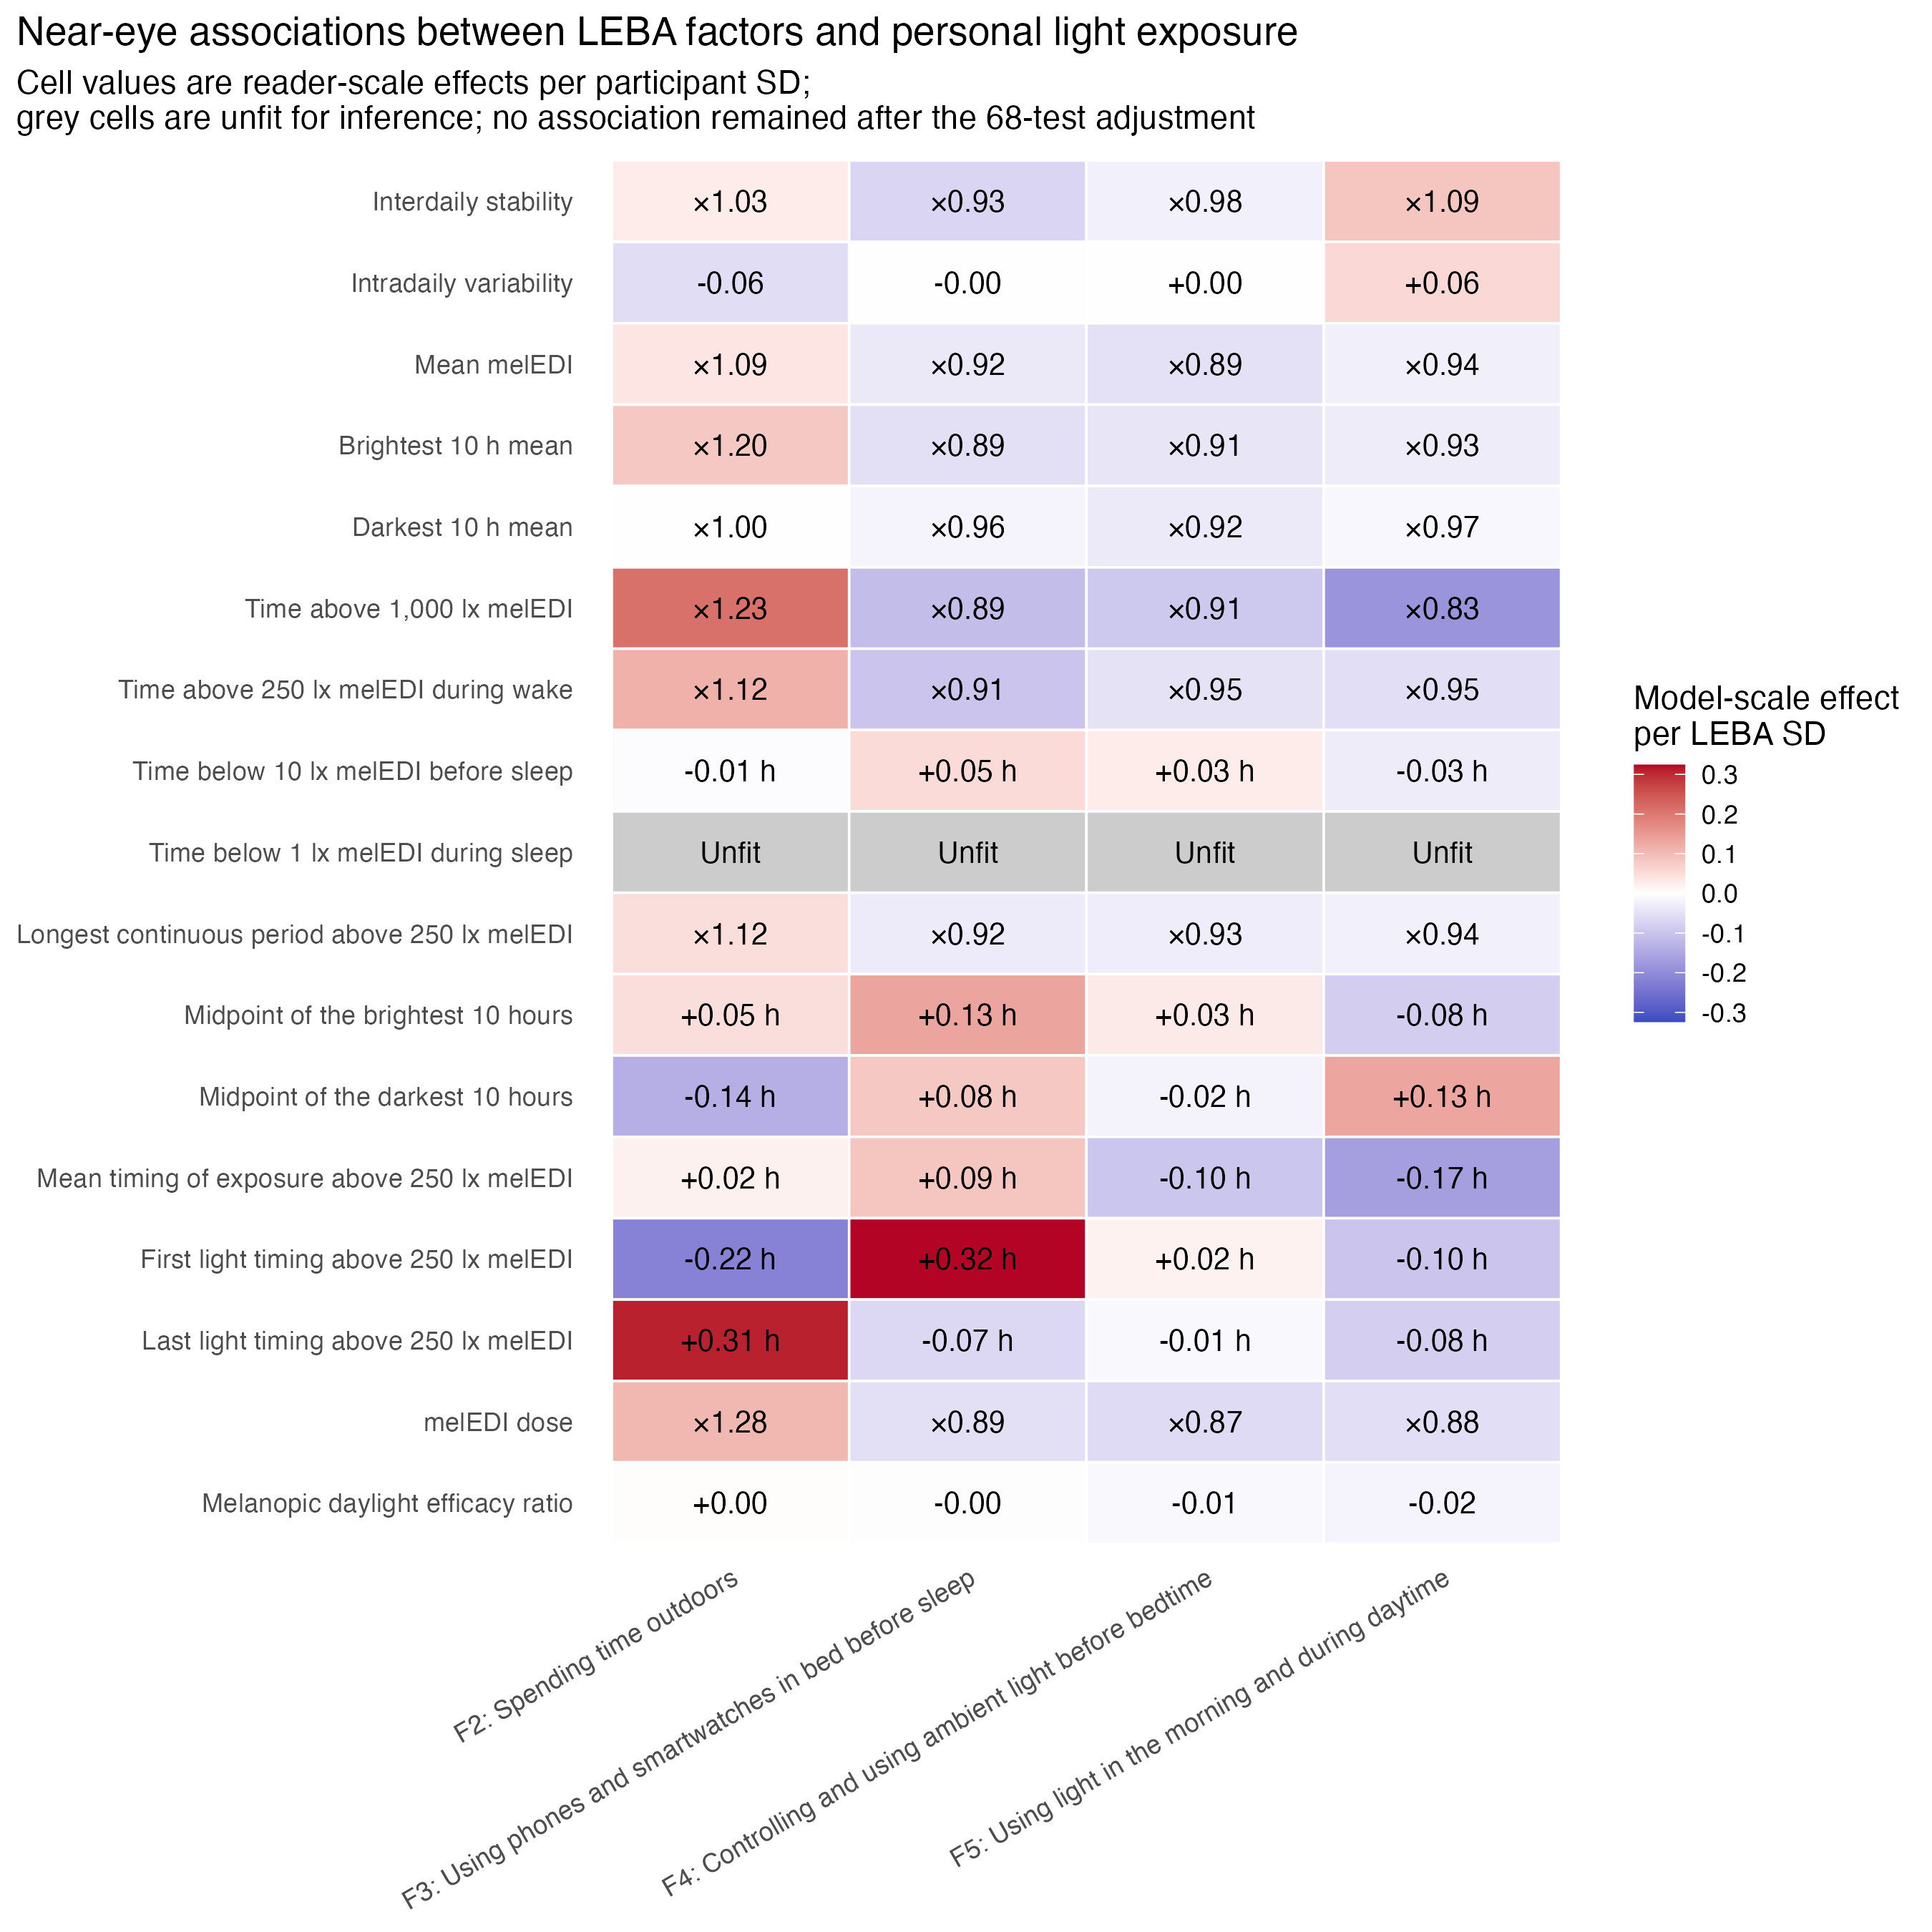
Supplementary Figure S15. Visual light sensitivity
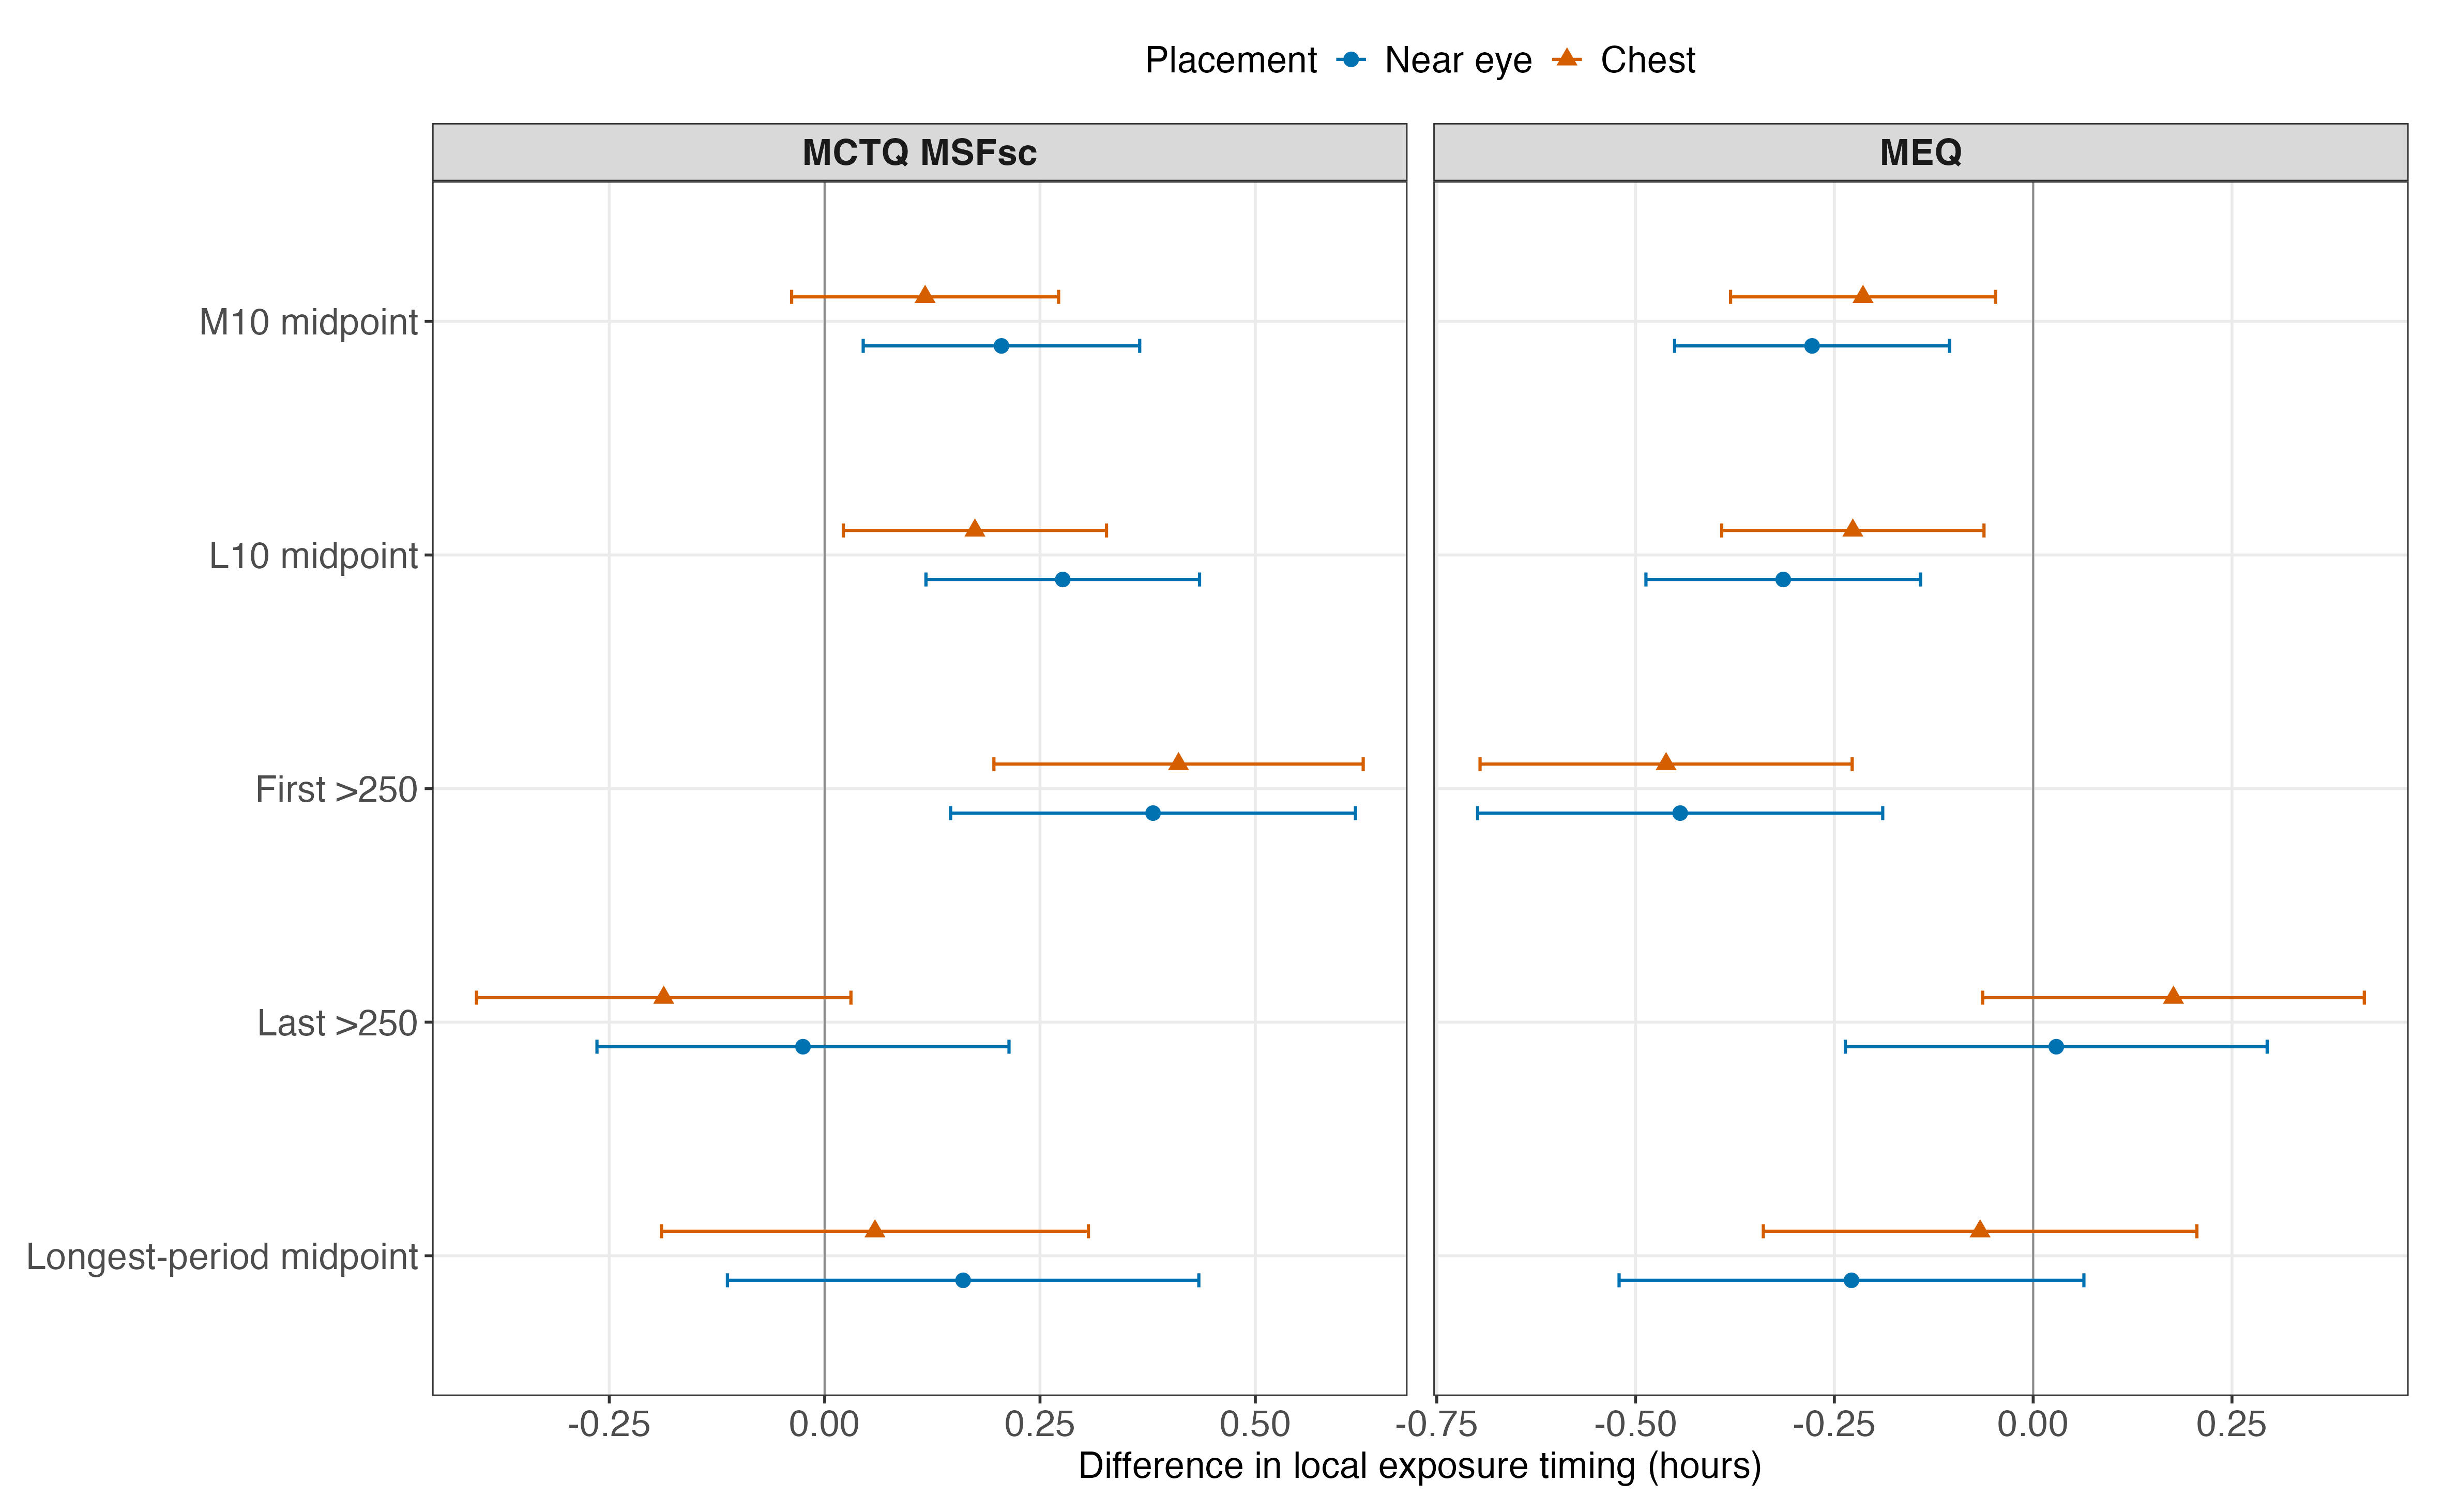
Supplementary Figure S16. Adjusted chronotype associations
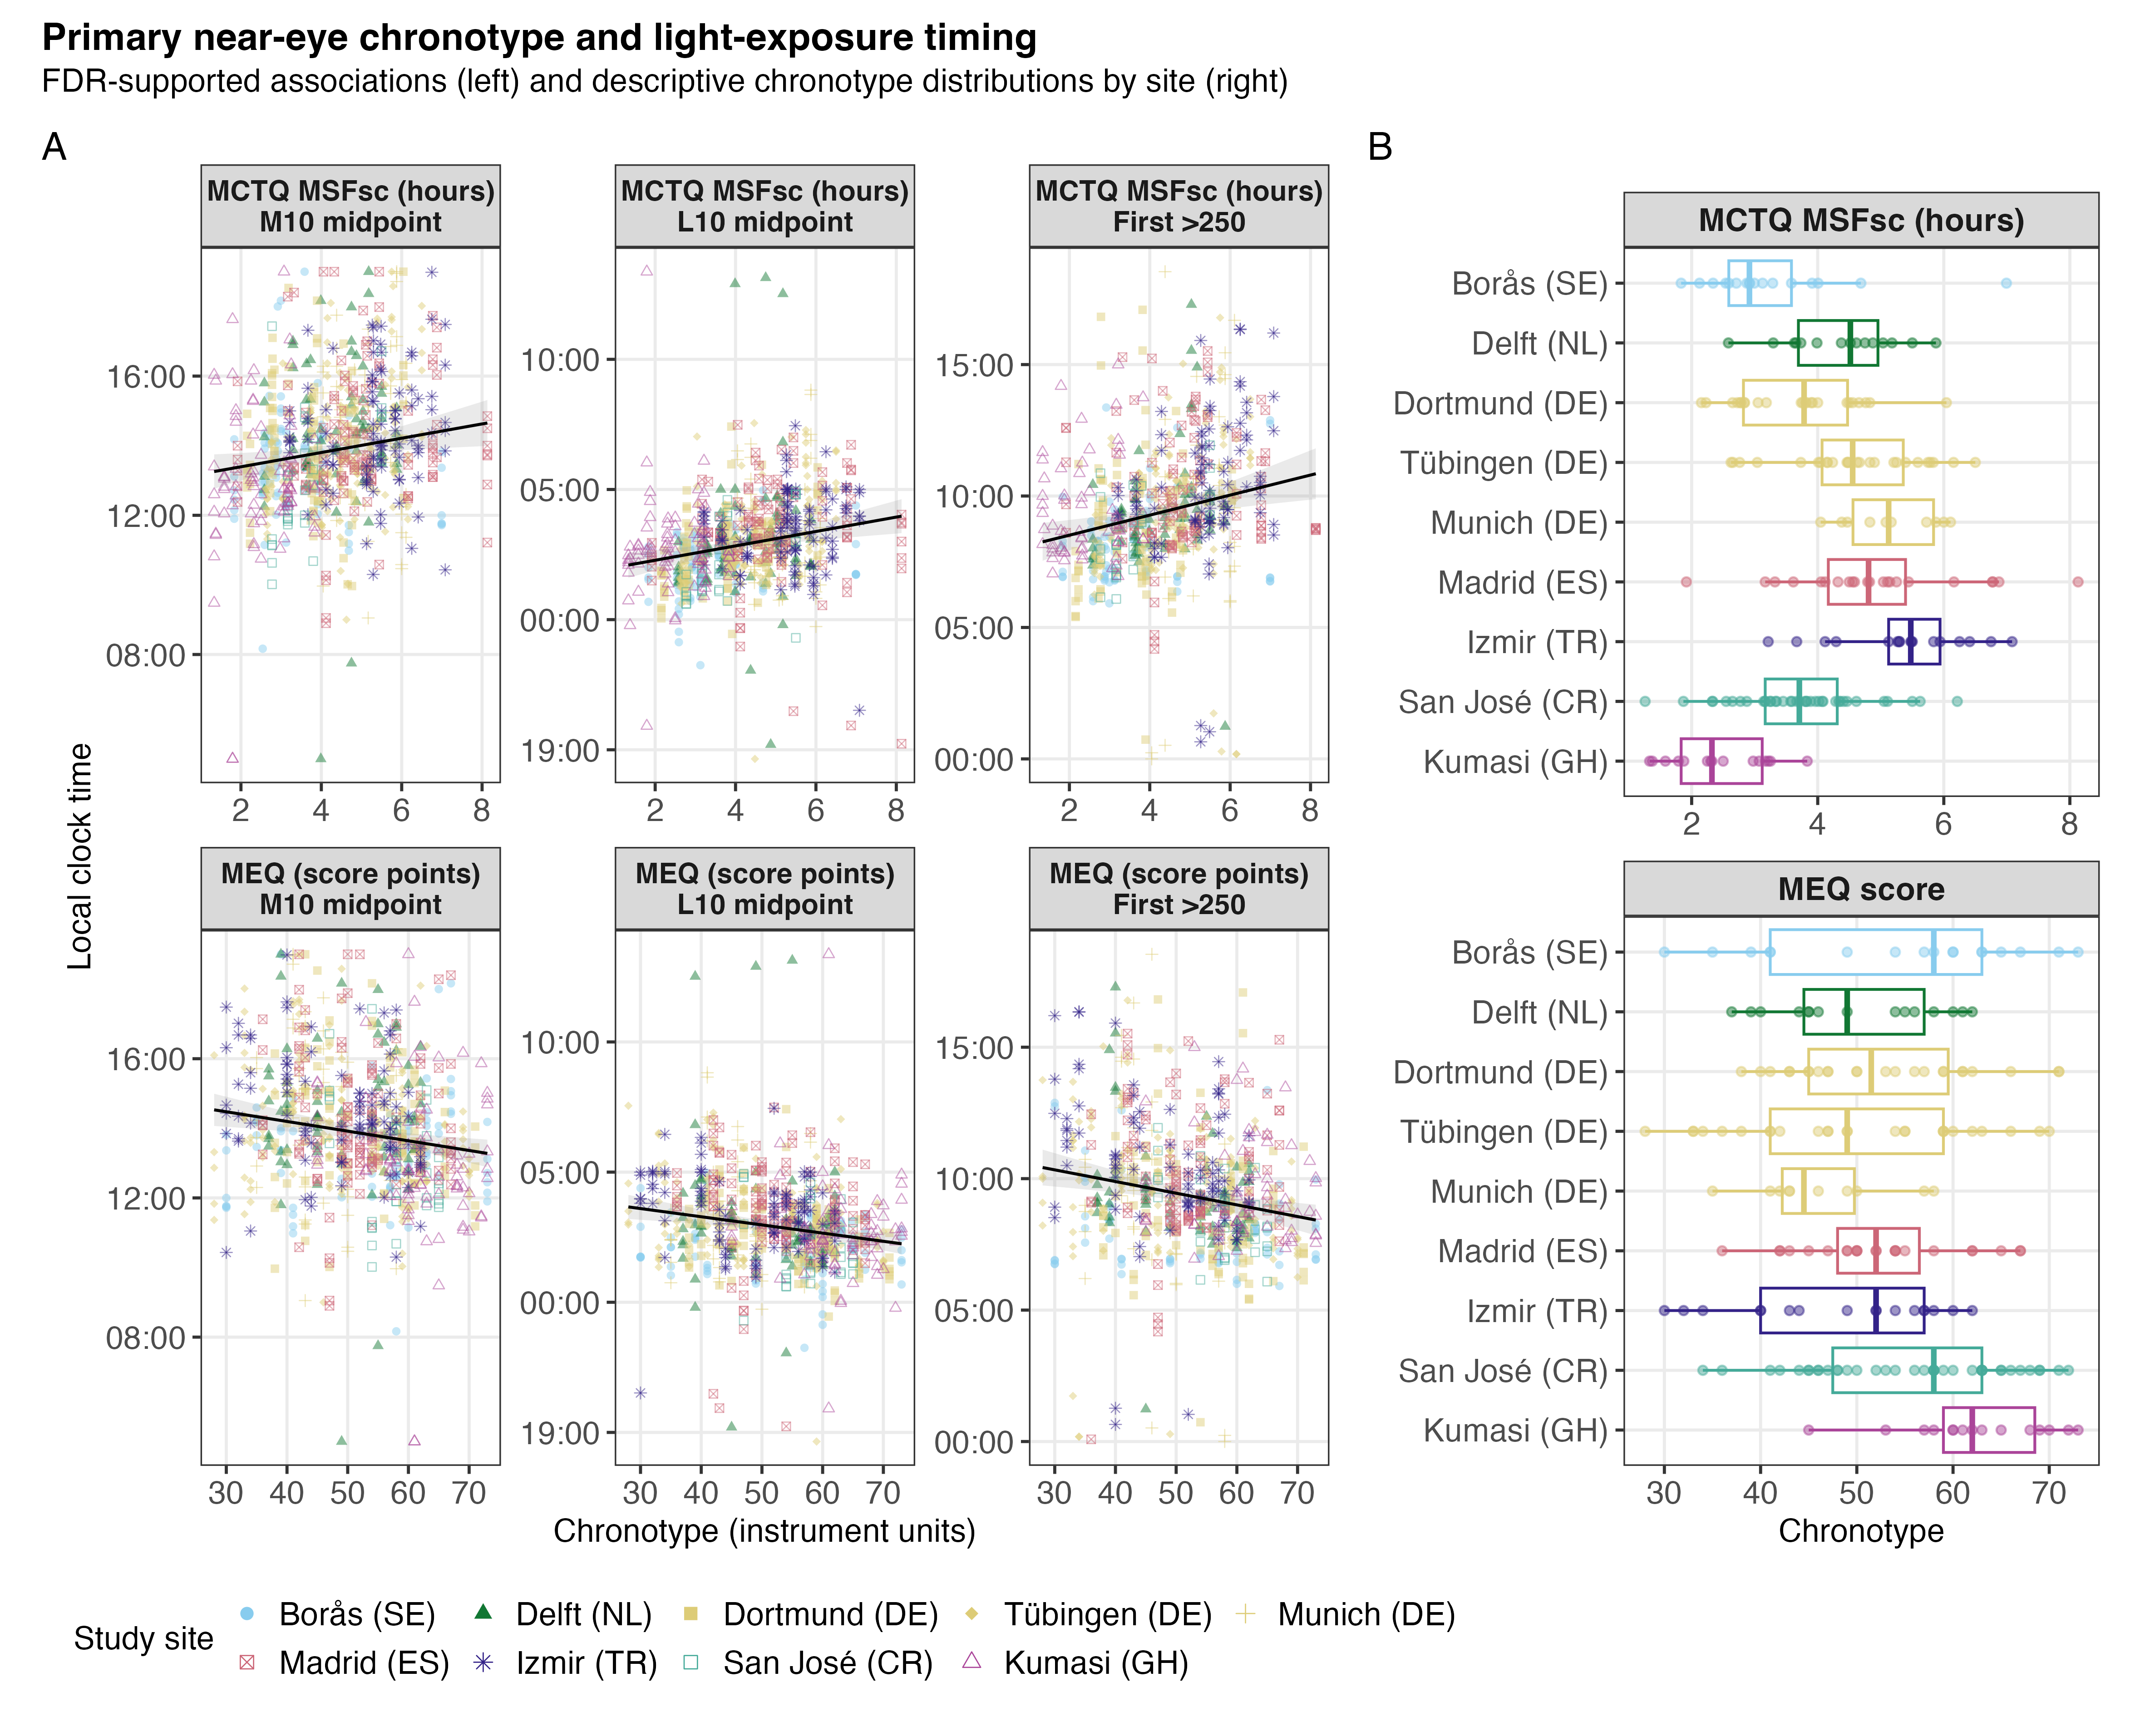
Supplementary Figure S17. Observed timing across chronotype and study sites
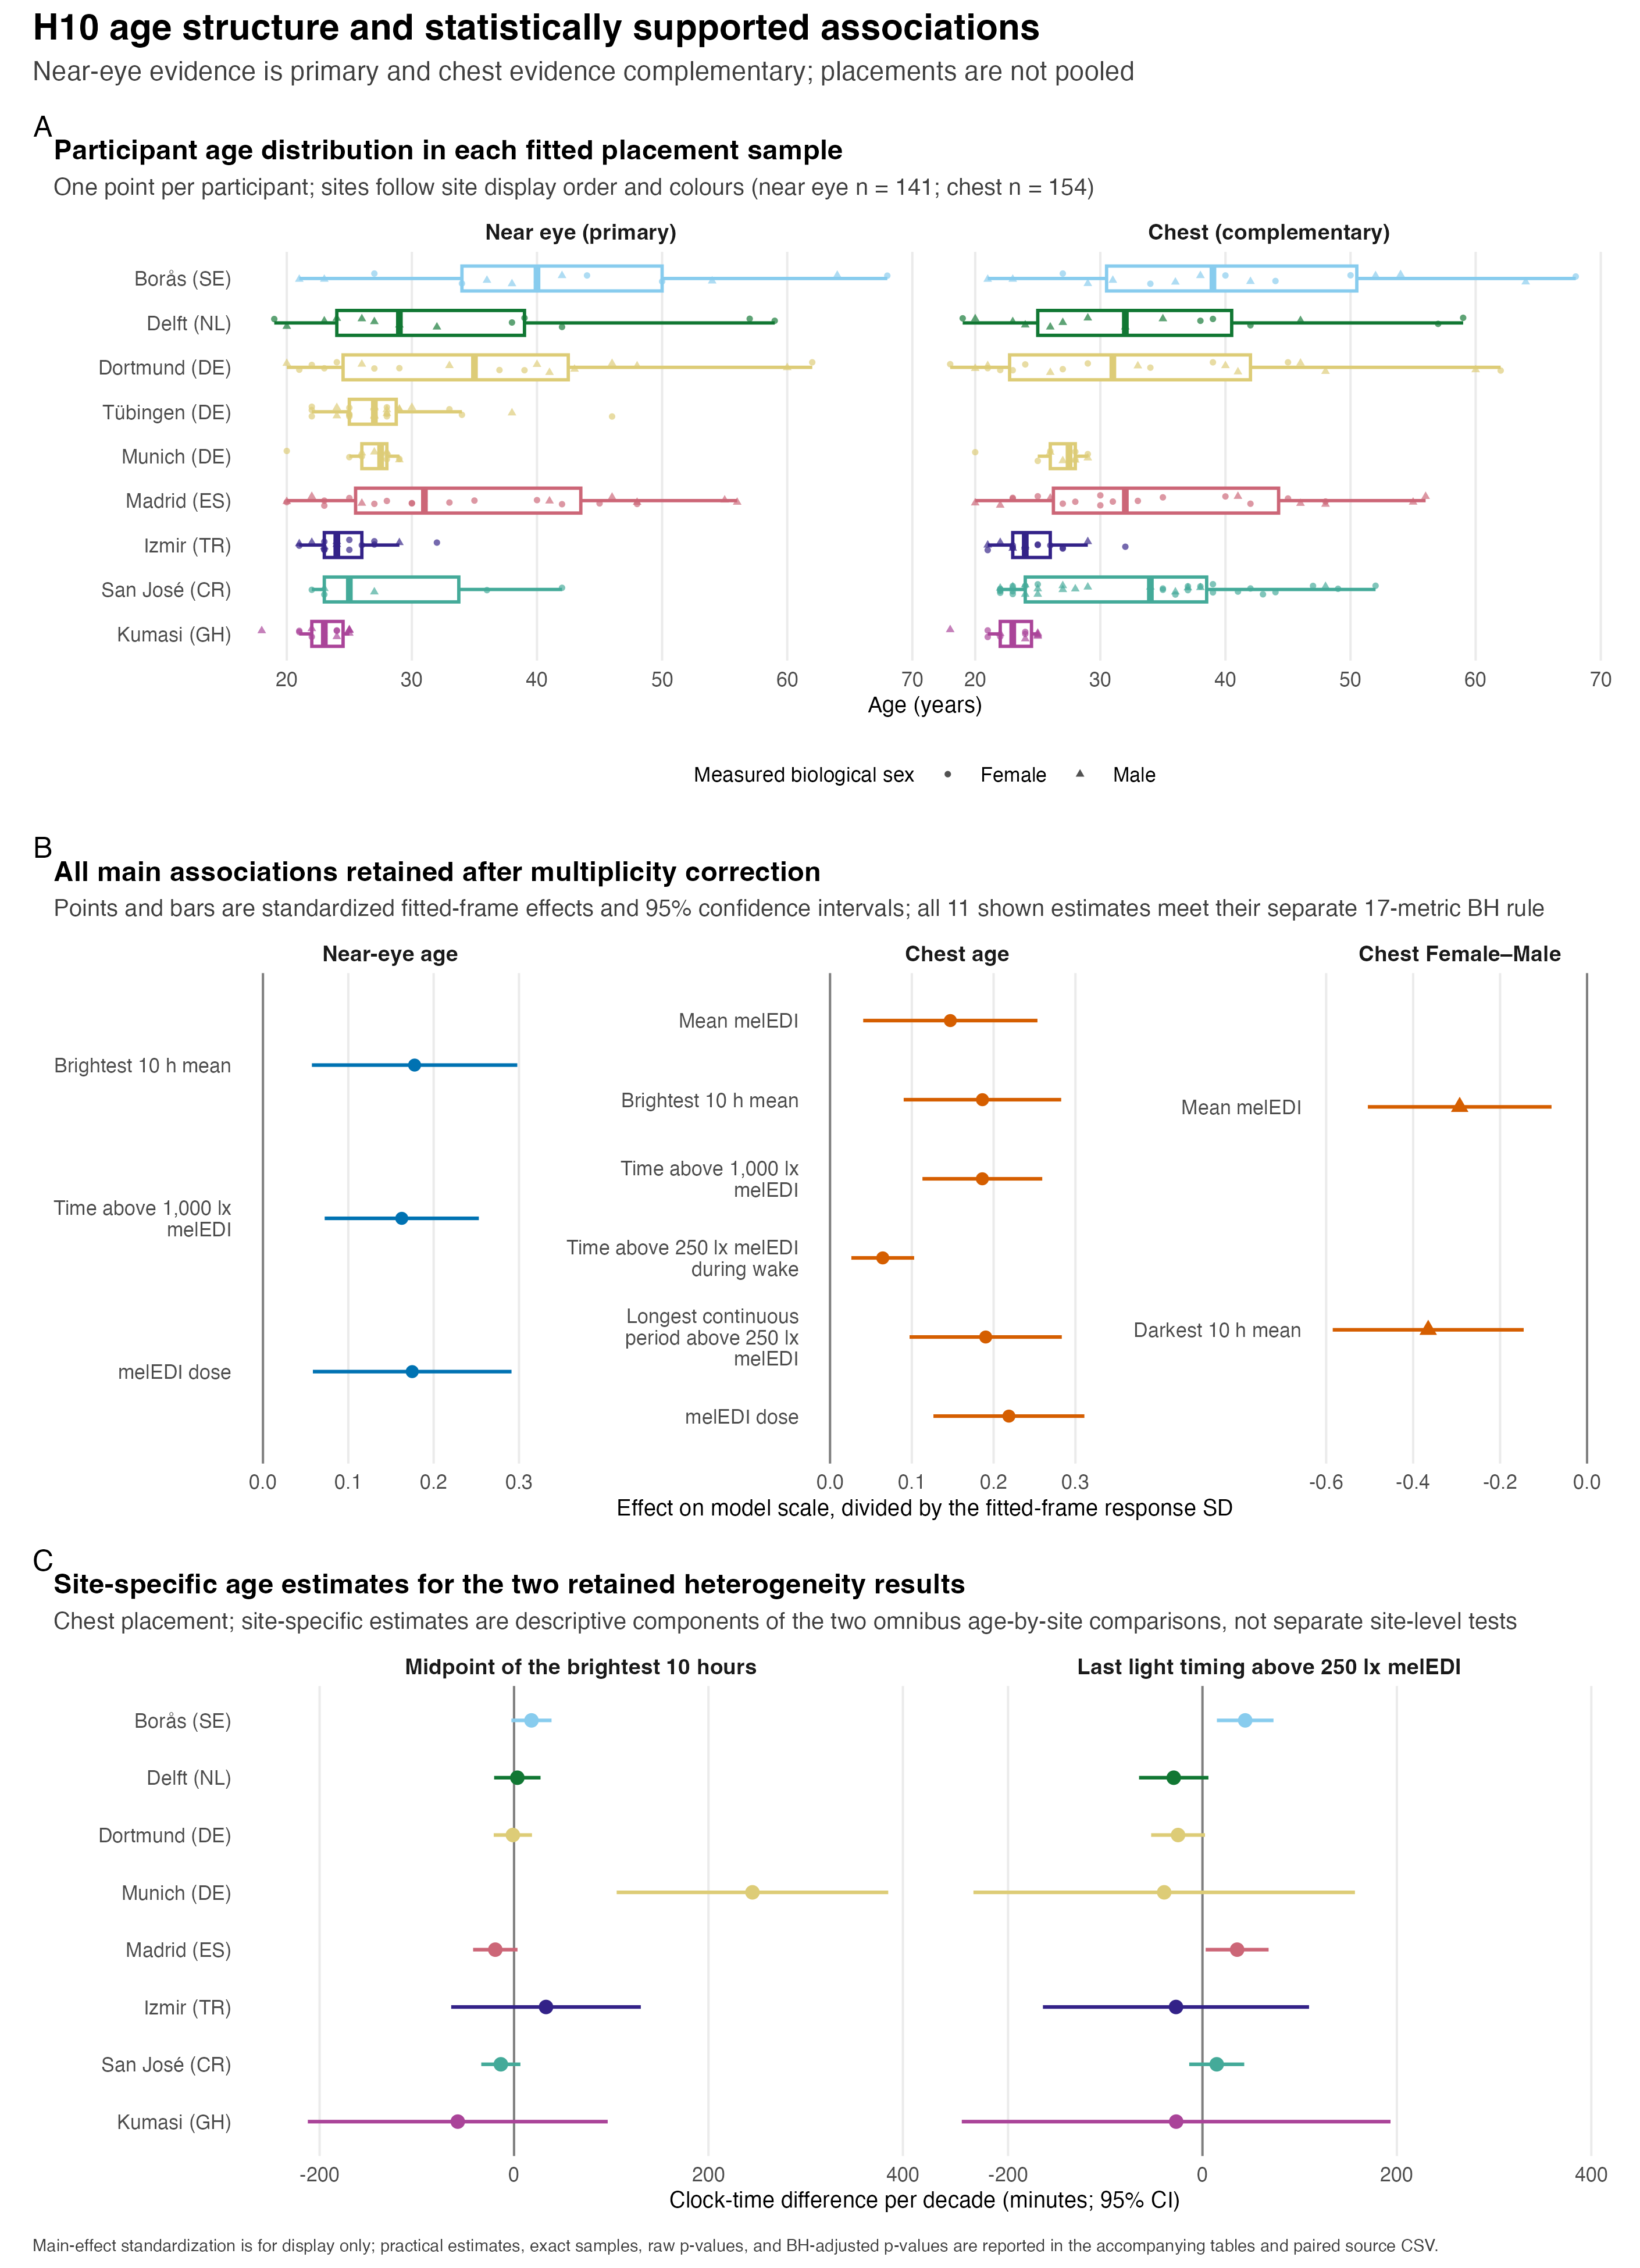
Supplementary Figure S18. Age and biological sex
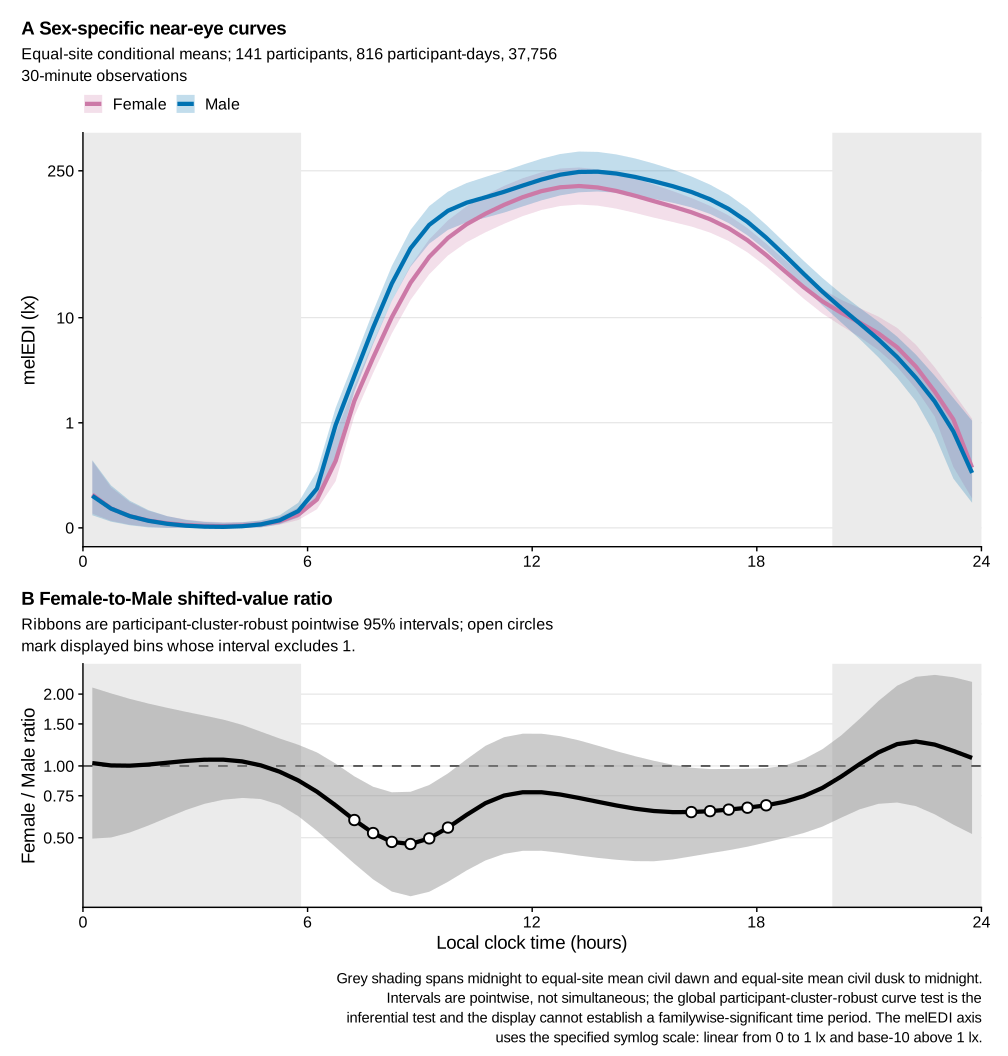
Supplementary Figure S19. Biological-sex-specific daily curves
Supplementary tables
Supplementary Table S1. Descriptive sample flow
Supplementary Table S1. Participant, participant-day, and one-minute observation counts across the roster, sensor-specific completeness and all-zero screens, final descriptive datasets, and paired main subset. Each row names its denominator explicitly. An excluded participant-day is not necessarily an excluded participant.
Supplementary Table S2. Full near-eye metric dictionary and distributions
| Metric descriptive summary (near eye) | |||||||||||||
| Metric1 | Unit | Overall | Borås (SE) | Delft (NL) | Dortmund (DE) | Tübingen (DE) | Munich (DE) | Madrid (ES) | Izmir (TR) | San José (CR) | Kumasi (GH) | Scaling2 | Distribution3 |
|---|---|---|---|---|---|---|---|---|---|---|---|---|---|
| Duration | |||||||||||||
| Time above 1,000 lx melEDI Bright-light exposure duration; relevant to daytime alerting and circadian entrainment. |
HH:MM | 00:41 (00:11, 01:34) 01:10 ± 01:28 N=141; d=816 |
01:18 (00:31, 03:24) 02:00 ± 01:54 N=13; d=78 |
01:18 (00:29, 02:12) 01:33 ± 01:28 N=13; d=78 |
01:03 (00:20, 02:32) 01:48 ± 02:14 N=18; d=107 |
00:40 (00:07, 01:25) 01:06 ± 01:22 N=26; d=150 |
00:39 (00:10, 01:46) 01:09 ± 01:18 N=10; d=60 |
00:27 (00:06, 00:53) 00:38 ± 00:47 N=23; d=129 |
00:30 (00:06, 01:04) 00:44 ± 00:51 N=17; d=101 |
00:19 (00:09, 00:43) 00:32 ± 00:33 N=6; d=32 |
00:43 (00:17, 01:14) 00:58 ± 00:57 N=15; d=81 |
Symlog (base 10; threshold 1) | |
| Time above 250 lx melEDI during wake Waking time in recommended daytime light; relevant to alertness, entrainment, and subsequent sleep. |
HH:MM | 02:25 (00:51, 04:37) 03:00 ± 02:29 N=141; d=737 |
04:06 (02:30, 06:15) 04:21 ± 02:24 N=13; d=73 |
03:29 (02:03, 05:16) 03:39 ± 02:25 N=13; d=64 |
03:42 (02:05, 05:58) 04:05 ± 02:51 N=18; d=90 |
02:01 (00:47, 04:20) 02:52 ± 02:39 N=26; d=141 |
02:38 (00:55, 04:19) 02:57 ± 02:19 N=10; d=54 |
02:43 (00:54, 04:43) 03:02 ± 02:19 N=23; d=113 |
01:30 (00:41, 03:26) 02:09 ± 01:57 N=17; d=94 |
01:39 (00:32, 02:40) 01:48 ± 01:21 N=6; d=30 |
01:14 (00:25, 02:37) 01:45 ± 01:46 N=15; d=78 |
Symlog (base 10; threshold 1) | |
| Time below 10 lx melEDI before sleep Low-light time before bed; limits evening melatonin suppression and circadian delay. |
HH:MM | 01:53 (01:02, 02:35) 01:51 ± 01:02 N=139; d=655 |
02:16 (01:30, 02:39) 02:05 ± 00:53 N=13; d=67 |
01:50 (01:21, 02:52) 01:59 ± 00:57 N=12; d=50 |
01:42 (00:53, 02:17) 01:41 ± 00:58 N=18; d=84 |
01:52 (01:04, 02:25) 01:52 ± 01:06 N=26; d=132 |
01:43 (00:42, 02:32) 01:45 ± 01:10 N=10; d=52 |
01:43 (00:58, 02:50) 01:50 ± 01:05 N=23; d=105 |
01:31 (00:48, 02:15) 01:38 ± 01:00 N=17; d=82 |
02:16 (01:15, 02:39) 01:56 ± 01:00 N=6; d=25 |
02:30 (01:28, 02:52) 02:09 ± 00:57 N=14; d=58 |
Symlog (base 10; threshold 1) | |
| Time below 1 lx melEDI during sleep Darkness during sleep; supports nocturnal melatonin and an undisturbed sleep environment. |
HH:MM | 07:08 (05:58, 08:15) 07:04 ± 01:57 N=141; d=778 |
07:08 (06:03, 08:18) 07:12 ± 01:46 N=13; d=76 |
07:14 (05:56, 08:06) 07:01 ± 01:50 N=13; d=68 |
07:08 (05:56, 08:16) 07:05 ± 01:50 N=18; d=95 |
06:54 (05:52, 07:46) 06:47 ± 01:30 N=26; d=150 |
05:52 (04:41, 07:03) 05:58 ± 01:58 N=10; d=60 |
08:06 (07:10, 09:10) 08:02 ± 01:57 N=23; d=118 |
06:45 (05:08, 08:15) 06:40 ± 02:07 N=17; d=99 |
06:56 (06:06, 07:36) 06:39 ± 01:43 N=6; d=31 |
07:31 (06:31, 09:00) 07:35 ± 02:15 N=15; d=81 |
Symlog (base 10; threshold 1) | |
| Longest period above 250 lx melEDI Longest sustained bright-light bout; captures continuity of daytime circadian stimulation. |
HH:MM | 00:38 (00:17, 01:12) 00:55 ± 01:00 N=141; d=816 |
00:56 (00:28, 01:27) 01:12 ± 01:02 N=13; d=78 |
00:48 (00:23, 01:20) 01:09 ± 01:15 N=13; d=78 |
01:00 (00:21, 01:40) 01:20 ± 01:31 N=18; d=107 |
00:35 (00:13, 01:06) 00:50 ± 00:54 N=26; d=150 |
00:38 (00:18, 01:32) 01:01 ± 01:02 N=10; d=60 |
00:38 (00:16, 01:04) 00:45 ± 00:36 N=23; d=129 |
00:34 (00:14, 00:55) 00:43 ± 00:41 N=17; d=101 |
00:28 (00:16, 00:43) 00:30 ± 00:20 N=6; d=32 |
00:23 (00:15, 00:49) 00:38 ± 00:45 N=15; d=81 |
Symlog (base 10; threshold 1) | |
| Dynamics | |||||||||||||
| Interdaily stability Day-to-day regularity of the light–dark pattern; higher regularity supports circadian stability. |
dimensionless | 0.308 (0.248, 0.38) 0.318 ± 0.095 N=141; d=816 |
0.311 (0.272, 0.367) 0.315 ± 0.078 N=13; d=78 |
0.258 (0.239, 0.389) 0.288 ± 0.094 N=13; d=78 |
0.264 (0.219, 0.319) 0.274 ± 0.074 N=18; d=107 |
0.329 (0.263, 0.424) 0.344 ± 0.107 N=26; d=150 |
0.244 (0.218, 0.277) 0.252 ± 0.058 N=10; d=60 |
0.352 (0.321, 0.455) 0.368 ± 0.092 N=23; d=129 |
0.278 (0.254, 0.394) 0.323 ± 0.104 N=17; d=101 |
0.342 (0.315, 0.473) 0.37 ± 0.118 N=6; d=32 |
0.293 (0.255, 0.354) 0.299 ± 0.062 N=15; d=81 |
Identity | |
| Intradaily variability Within-day fragmentation of light exposure; higher values indicate less consolidated light–dark input. |
dimensionless | 1.253 (0.93, 1.502) 1.229 ± 0.389 N=141; d=816 |
0.997 (0.818, 1.388) 1.088 ± 0.343 N=13; d=78 |
1.193 (0.96, 1.389) 1.238 ± 0.345 N=13; d=78 |
1.182 (0.928, 1.49) 1.177 ± 0.407 N=18; d=107 |
1.154 (0.801, 1.442) 1.125 ± 0.354 N=26; d=150 |
1.48 (0.869, 1.642) 1.332 ± 0.477 N=10; d=60 |
1.251 (0.999, 1.497) 1.251 ± 0.413 N=23; d=129 |
1.359 (0.95, 1.546) 1.307 ± 0.415 N=17; d=101 |
1.399 (1.282, 1.483) 1.355 ± 0.256 N=6; d=32 |
1.324 (1.029, 1.595) 1.344 ± 0.413 N=15; d=81 |
Identity | |
| Exposure history | |||||||||||||
| melEDI dose Intensity–duration-weighted melanopic exposure; summarizes cumulative non-visual retinal light input. |
klx·h | 4.96 (1.936, 12.313) 10.358 ± 16.216 N=141; d=761 |
9.296 (3.892, 21.895) 19.923 ± 27.784 N=13; d=71 |
10.495 (3.855, 17.395) 15.881 ± 20.395 N=13; d=74 |
6.751 (2.469, 14.435) 13.809 ± 23.711 N=18; d=97 |
3.862 (1.411, 10.217) 7.719 ± 9.847 N=26; d=137 |
7.11 (1.897, 15.789) 10.055 ± 11.237 N=10; d=55 |
3.317 (1.703, 6.29) 6.115 ± 8.79 N=23; d=125 |
4.35 (1.791, 10.625) 7.49 ± 8.898 N=17; d=96 |
2.195 (1.339, 4.117) 3.281 ± 2.573 N=6; d=30 |
6.045 (2.49, 14.907) 10.016 ± 10.799 N=15; d=76 |
Symlog (base 10; threshold 1) | |
| Level | |||||||||||||
| Mean melEDI Geometric average of daily melEDI values, including zeros; summarizes overall exposure while reducing peak influence. |
lx | 5.154 (2.831, 9.225) 7.587 ± 9.496 N=141; d=816 |
7.569 (4.55, 11.613) 9.171 ± 7.111 N=13; d=78 |
6.659 (4.18, 11.674) 8.274 ± 6.558 N=13; d=78 |
7.704 (3.081, 13.924) 12.017 ± 18.865 N=18; d=107 |
5.232 (3.224, 8.188) 7.221 ± 6.33 N=26; d=150 |
9.013 (4.011, 15.089) 12.102 ± 12.013 N=10; d=60 |
3.505 (1.469, 6.211) 4.166 ± 3.272 N=23; d=129 |
5.857 (3.726, 7.986) 7.778 ± 6.946 N=17; d=101 |
4.325 (3.585, 6.77) 5.248 ± 2.85 N=6; d=32 |
2.144 (0.744, 4.042) 3.019 ± 2.896 N=15; d=81 |
Symlog (base 10; threshold 1) | |
| Brightest 10 h mean Mean of the brightest 10 hours; reflects the strength of the main daytime light episode. |
lx | 110.566 (41.513, 243.212) 214.866 ± 508.56 N=141; d=816 |
252.689 (104.514, 461.953) 399.302 ± 518.102 N=13; d=78 |
175.974 (78.625, 299.106) 262.206 ± 329.201 N=13; d=78 |
156.184 (67.783, 339.731) 422.54 ± 1,209.616 N=18; d=107 |
100.057 (33.255, 209.904) 179.372 ± 241.53 N=26; d=150 |
130.78 (54.044, 259.726) 201.947 ± 194.042 N=10; d=60 |
101.102 (24.355, 218.457) 136.312 ± 134.07 N=23; d=129 |
83.24 (53.17, 151.786) 120.172 ± 101.545 N=17; d=101 |
68.143 (45.331, 132.458) 96.735 ± 72.311 N=6; d=32 |
46.66 (9.242, 103.175) 82.489 ± 115.07 N=15; d=81 |
Symlog (base 10; threshold 1) | |
| Darkest 10 h mean Mean of the darkest 10 hours; lower values during the biological night favour melatonin preservation and sleep. |
lx | 0.103 (0.02, 0.253) 0.243 ± 0.513 N=141; d=816 |
0.08 (0.016, 0.191) 0.183 ± 0.299 N=13; d=78 |
0.1 (0.035, 0.23) 0.2 ± 0.332 N=13; d=78 |
0.14 (0.036, 0.282) 0.223 ± 0.299 N=18; d=107 |
0.149 (0.074, 0.309) 0.273 ± 0.465 N=26; d=150 |
0.325 (0.119, 0.71) 0.515 ± 0.653 N=10; d=60 |
0.022 (0, 0.08) 0.054 ± 0.075 N=23; d=129 |
0.152 (0.052, 0.481) 0.475 ± 0.882 N=17; d=101 |
0.133 (0.055, 0.309) 0.411 ± 1.044 N=6; d=32 |
0.01 (0, 0.092) 0.059 ± 0.104 N=15; d=81 |
Symlog (base 10; threshold 1) | |
| Spectrum | |||||||||||||
| Melanopic daylight efficacy ratio Mean of viable one-minute melEDI/illuminance ratios; indicates melanopic efficacy relative to visual light. |
dimensionless | 0.724 (0.643, 0.795) 0.724 ± 0.116 N=137; d=687 |
0.788 (0.725, 0.872) 0.796 ± 0.162 N=13; d=74 |
0.743 (0.699, 0.796) 0.743 ± 0.077 N=13; d=65 |
0.781 (0.675, 0.853) 0.768 ± 0.118 N=18; d=97 |
0.65 (0.592, 0.728) 0.667 ± 0.098 N=26; d=144 |
0.724 (0.652, 0.773) 0.72 ± 0.093 N=10; d=55 |
0.668 (0.629, 0.721) 0.673 ± 0.07 N=22; d=83 |
0.747 (0.634, 0.834) 0.735 ± 0.122 N=17; d=91 |
0.719 (0.661, 0.761) 0.706 ± 0.067 N=6; d=30 |
0.755 (0.729, 0.82) 0.758 ± 0.097 N=12; d=48 |
Identity | |
| Timing | |||||||||||||
| Midpoint of the brightest 10 hours Centre time of the brightest 10 hours; indexes the main daily circadian light cue. |
HH:MM clock time |
13:44 (12:48, 15:00) 13:56 ± 01:51 N=141; d=816 |
13:16 (12:28, 14:10) 13:20 ± 01:33 N=13; d=78 |
14:12 (13:23, 15:18) 14:22 ± 01:51 N=13; d=78 |
13:52 (12:54, 15:04) 14:00 ± 01:42 N=18; d=107 |
13:38 (12:47, 14:44) 13:52 ± 01:42 N=26; d=150 |
14:54 (12:50, 16:03) 14:31 ± 02:14 N=10; d=60 |
13:44 (13:06, 15:20) 14:10 ± 01:51 N=23; d=129 |
14:10 (13:32, 15:21) 14:25 ± 01:37 N=17; d=101 |
12:34 (11:49, 14:02) 12:55 ± 01:44 N=6; d=32 |
12:49 (12:06, 13:39) 13:03 ± 01:58 N=15; d=81 |
Circular clock | |
| Midpoint of the darkest 10 hours Centre time of the darkest 10 hours; indexes the main daily darkness cue. |
HH:MM clock time |
02:54 (02:01, 03:50) 02:58 ± 01:41 N=141; d=816 |
02:02 (01:24, 02:48) 02:03 ± 01:07 N=13; d=78 |
02:55 (02:01, 03:28) 02:50 ± 02:05 N=13; d=78 |
02:32 (01:45, 03:22) 02:37 ± 01:19 N=18; d=107 |
03:08 (02:11, 04:10) 03:16 ± 01:34 N=26; d=150 |
02:37 (01:54, 04:17) 03:10 ± 02:00 N=10; d=60 |
03:39 (02:43, 04:34) 03:34 ± 01:49 N=23; d=129 |
03:31 (02:33, 04:14) 03:26 ± 01:25 N=17; d=101 |
01:45 (01:05, 03:01) 02:10 ± 01:27 N=6; d=32 |
02:33 (02:04, 03:17) 02:36 ± 01:36 N=15; d=81 |
Circular clock | |
| First light timing above 250 lx melEDI First waking bright-light exposure; morning timing can advance circadian phase and promote alertness. |
HH:MM clock time |
09:08 (08:02, 10:40) 09:26 ± 02:22 N=140; d=727 |
07:57 (06:56, 08:33) 08:03 ± 01:32 N=13; d=74 |
09:04 (08:18, 09:52) 09:17 ± 01:56 N=13; d=68 |
08:36 (07:10, 10:13) 08:45 ± 02:21 N=18; d=93 |
09:43 (08:13, 10:53) 09:45 ± 02:21 N=25; d=133 |
09:36 (07:58, 10:53) 09:39 ± 03:12 N=10; d=56 |
09:32 (08:40, 11:21) 10:05 ± 02:18 N=23; d=118 |
10:01 (09:06, 11:52) 10:26 ± 02:28 N=17; d=95 |
08:11 (07:26, 09:57) 08:36 ± 01:30 N=6; d=29 |
08:43 (08:01, 10:10) 09:19 ± 01:52 N=15; d=61 |
Circular clock | |
| Last light timing above 250 lx melEDI Last bright-light exposure; later timing may delay circadian phase and sleep onset. |
HH:MM clock time |
18:08 (16:27, 19:42) 18:03 ± 02:36 N=141; d=687 |
18:41 (17:38, 19:38) 18:39 ± 01:38 N=13; d=73 |
18:30 (17:37, 19:59) 18:37 ± 02:08 N=13; d=62 |
19:34 (18:04, 20:42) 19:16 ± 02:28 N=18; d=89 |
17:37 (15:35, 19:09) 17:18 ± 02:44 N=26; d=121 |
19:50 (18:37, 20:50) 19:33 ± 02:11 N=10; d=53 |
17:48 (16:46, 19:19) 18:01 ± 02:21 N=23; d=106 |
18:45 (17:02, 19:38) 18:23 ± 02:15 N=17; d=89 |
15:45 (13:20, 16:38) 15:22 ± 02:38 N=6; d=28 |
15:54 (14:34, 17:25) 15:46 ± 02:13 N=15; d=66 |
Circular clock | |
| Mean timing of exposure above 250 lx melEDI Average bright-light timing; summarizes the phase of daily circadian stimulation. |
HH:MM clock time |
13:29 (12:29, 14:39) 13:31 ± 01:52 N=141; d=742 |
13:20 (12:29, 14:24) 13:21 ± 01:25 N=13; d=72 |
13:52 (13:13, 15:06) 14:02 ± 01:41 N=13; d=71 |
13:44 (12:28, 14:55) 13:51 ± 01:56 N=18; d=93 |
13:17 (12:17, 14:31) 13:24 ± 01:45 N=26; d=138 |
14:04 (12:58, 15:25) 14:09 ± 02:22 N=10; d=55 |
13:43 (12:55, 14:29) 13:47 ± 01:33 N=23; d=117 |
13:58 (12:54, 14:58) 14:04 ± 01:39 N=17; d=94 |
11:30 (10:28, 12:38) 11:26 ± 01:36 N=6; d=31 |
12:17 (11:04, 13:04) 12:11 ± 01:36 N=15; d=71 |
Circular clock | |
| Median (25th percentile, 75th percentile), circular or arithmetic mean ± standard deviation, N=participants; d=participant-days with a finite value for that metric. | |||||||||||||
| 1 The brief meaning and relevance notes describe established physiological constructs; this descriptive table does not estimate individual health effects. | |||||||||||||
| 2 Scaling describes the distribution column only; printed values remain on their stated scale. Symlog uses base 10 with a linear region through 1 in the stated unit; Identity is linear; Circular clock unwraps values around the metric-specific clock centre. | |||||||||||||
| 3 Red lines indicate site medians. Symlog and circular-clock rows are transformed only for plotting. | |||||||||||||


Supplementary Table S2. Definitions, exact support, median (interquartile range) summaries, and density displays for the 17 near-eye personal light-exposure metrics overall and by site. Values use three decimal places where applicable. Metrics are distinct summaries and should not be interpreted as interchangeable outcomes.
Supplementary Table S3. Descriptive recommendation-range fractions
| Site1 |
Minutes in the recommended range:2
|
Share of all eligible real minutes:3
|
||||||
|---|---|---|---|---|---|---|---|---|
| Daytime | Pre-sleep | Sleep4 | Total5 | Wake | Pre-sleep | Sleep | Unclassified6 | |
| Overall | 24.0% 137,792 / 573,712 |
63.3% 81,894 / 129,390 |
87.7% 336,052 / 383,366 |
51.2% 555,738 / 1,086,468 |
51.6% 606,215 / 1,175,160 |
11.9% 140,152 / 1,175,160 |
32.6% 383,607 / 1,175,160 |
3.8% 45,186 / 1,175,160 |
| Borås (SE) | 33.2% 19,225 / 57,952 |
69.9% 8,914 / 12,759 |
93.4% 33,152 / 35,489 |
57.7% 61,291 / 106,200 |
54.0% 60,642 / 112,260 |
12.2% 13,704 / 112,260 |
31.7% 35,549 / 112,260 |
2.1% 2,365 / 112,260 |
| Delft (NL) | 29.6% 14,760 / 49,852 |
66.7% 7,181 / 10,774 |
86.4% 29,915 / 34,621 |
54.4% 51,856 / 95,247 |
47.0% 52,755 / 112,260 |
10.9% 12,283 / 112,260 |
30.9% 34,682 / 112,260 |
11.2% 12,540 / 112,260 |
| Dortmund (DE) | 32.4% 22,631 / 69,900 |
59.6% 9,749 / 16,361 |
87.5% 42,829 / 48,928 |
55.6% 75,209 / 135,189 |
48.1% 74,094 / 154,080 |
11.3% 17,409 / 154,080 |
31.8% 48,928 / 154,080 |
8.9% 13,649 / 154,080 |
| Tübingen (DE) | 22.5% 25,082 / 111,396 |
61.8% 15,623 / 25,283 |
87.1% 61,030 / 70,029 |
49.2% 101,735 / 206,708 |
55.1% 119,150 / 216,120 |
12.4% 26,881 / 216,120 |
32.4% 70,089 / 216,120 |
0.0% 0 / 216,120 |
| Munich (DE) | 25.0% 10,681 / 42,685 |
60.6% 5,963 / 9,833 |
71.7% 21,485 / 29,951 |
46.2% 38,129 / 82,469 |
53.0% 45,831 / 86,400 |
12.3% 10,618 / 86,400 |
34.7% 29,951 / 86,400 |
0.0% 0 / 86,400 |
| Madrid (ES) | 24.2% 21,067 / 87,030 |
62.7% 12,766 / 20,366 |
95.9% 58,374 / 60,891 |
54.8% 92,207 / 168,287 |
48.4% 89,948 / 185,880 |
11.7% 21,684 / 185,880 |
32.8% 60,891 / 185,880 |
7.2% 13,357 / 185,880 |
| Izmir (TR) | 17.8% 12,708 / 71,562 |
55.1% 9,221 / 16,736 |
79.0% 39,936 / 50,556 |
44.6% 61,865 / 138,854 |
51.5% 74,926 / 145,440 |
12.3% 17,883 / 145,440 |
34.8% 50,556 / 145,440 |
1.4% 2,075 / 145,440 |
| San José (CR) | 13.8% 3,266 / 23,640 |
64.6% 3,124 / 4,839 |
87.1% 12,438 / 14,275 |
44.0% 18,828 / 42,754 |
54.9% 25,285 / 46,080 |
11.5% 5,320 / 46,080 |
31.0% 14,275 / 46,080 |
2.6% 1,200 / 46,080 |
| Kumasi (GH) | 14.0% 8,372 / 59,695 |
75.2% 9,353 / 12,439 |
95.5% 36,893 / 38,626 |
49.3% 54,618 / 110,760 |
54.5% 63,584 / 116,640 |
12.3% 14,370 / 116,640 |
33.2% 38,686 / 116,640 |
0.0% 0 / 116,640 |
| 1 Near eye participant and participant-day sample sizes are reported in the participant table; every percentage cell gives its exact minute denominator. | ||||||||
| 2 Recommended ranges follow Brown et al. (2022): Daytime ≥250 lx melanopic EDI, Pre-sleep ≤10 lx melanopic EDI, and Sleep ≤1 lx melanopic EDI. Daytime, Pre-sleep, and Sleep identify the recommendation windows. Each grey numerator/denominator gives minutes within the applicable recommendation range over all valid one-minute observations in that window. Sleep describes the bedside sleep environment. | ||||||||
| 3 Each grey numerator/denominator gives minutes in the displayed diary state over all eligible real minutes before classification by diary state or measurement availability. | ||||||||
| 4 During diary-defined sleep the bedside sensor describes the sleep environment rather than direct ocular exposure. | ||||||||
| 5 Total pools all classified valid minutes. | ||||||||
| 6 Unclassified time can result from missing diary state, missing or removed melEDI measurements, or both. | ||||||||
Supplementary Table S3. Fractions of valid near-eye minutes meeting each Brown et al. recommendation range, with explicit numerators and denominators. Daytime, Pre-sleep, and Sleep identify the recommendation windows. The Sleep summaries use near-eye illuminance recorded during sleep and describe the bedside sleep environment rather than verified ocular exposure. These pooled-minute summaries are descriptive and differ from the modelled recommendation-window-period estimates in main Table 2.
Supplementary Table S4. Exploratory cross-window recommendation-adherence associations
| Window | Difference, percentage points (95% CI) | FDR-adjusted p |
|---|---|---|
| Within participant | ||
| Sleep | -0.26 (-0.95 to 0.43) | 0.453 |
| Pre-sleep | -1.09 (-2.75 to 0.56) | 0.258 |
| Between participants | ||
| Sleep | -2.52 (-3.55 to -1.48) | <0.001 |
| Pre-sleep | -3.59 (-5.94 to -1.25) | 0.005 |
| Contrasts are per 10 percentage points higher daytime adherence. Within-participant contrasts concern deviations from each participant's monitoring-period average; between-participant contrasts concern those averages. The four associations form one FDR family. Unresolved temporal dependence precludes a within-participant day-level claim. | ||
Supplementary Table S4. Exploratory within-participant and between-participant associations across Brown et al. recommendation windows. Results are percentage-point differences per 10 percentage points higher Daytime adherence. The four tests form one FDR family. The within-participant day-level claim is withheld because serial dependence remains unresolved. Between-participant results describe observed monitoring-period averages and do not establish rankings, stable traits, or causal effects.
Supplementary Table S5. Near-eye fitted-curve dispersion and full-model R² allocation
| Fitted-curve result (95% CI) | Shapley allocation (95% CI) | Share of full-model R² (95% CI) | |
|---|---|---|---|
| Shared local-clock curve | Not applicable | 0.611 (0.550 to 0.657) | 78.9 (73.6 to 82.6)% |
| Site pattern | 0.100 (0.041 to 0.139) | 0.016 (0.007 to 0.026) | 2.0 (0.9 to 3.5)% |
| Participant pattern | 0.180 (0.126 to 0.214) | 0.100 (0.079 to 0.125) | 12.9 (10.1 to 16.4)% |
| Participant-day shift | 0.019 (0.010 to 0.024) | 0.048 (0.035 to 0.064) | 6.2 (4.4 to 8.6)% |
| Participant pattern + day shift | 0.200 (0.140 to 0.230) | Not separately allocated | Not applicable |
| Participant / site | 1.797 (1.157 to 4.332) | 6.41 (3.85 to 15.14) | Not applicable |
| (Participant + day) / site | 1.991 (1.291 to 4.767) | 9.49 (5.77 to 21.81) | 90.5 (85.2 to 95.6)% |
| Fitted-curve variation is in squared log10(melanopic EDI + 0.1 lx) prediction units; ratios are unitless. The shared local-clock curve remains the baseline in every component model. Intervals are conditional hierarchical cluster-bootstrap percentiles from 2,000 replicates. In the final row, the percentage is the participant-plus-day share of heterogeneity, excluding the shared local-clock contribution. Dispersion and R² allocation are distinct estimands. | |||
Supplementary Table S5. Near-eye fitted-curve dispersion and Shapley allocation of full-model in-sample R². Fitted-curve variation is in squared log10(melanopic EDI + 0.1 lx) prediction units; dispersion and R²-share ratios are unitless. The allocation includes the shared local-clock curve in every component model as the baseline. Intervals are 95% hierarchical cluster-bootstrap percentile intervals from 2,000 replicates and are conditional on the fitted models. Dispersion and R² allocation describe different estimands and should not be added or interpreted causally.
Supplementary Table S6. Chest fitted-curve dispersion and full-model R² allocation
| Fitted-curve result (95% CI) | Shapley allocation (95% CI) | Share of full-model R² (95% CI) | |
|---|---|---|---|
| Shared local-clock curve | Not applicable | 0.583 (0.523 to 0.629) | 79.1 (73.6 to 82.8)% |
| Site pattern | 0.101 (0.049 to 0.116) | 0.015 (0.008 to 0.024) | 2.1 (1.1 to 3.3)% |
| Participant pattern | 0.148 (0.100 to 0.199) | 0.087 (0.071 to 0.110) | 11.9 (9.5 to 15.3)% |
| Participant-day shift | 0.035 (0.020 to 0.039) | 0.051 (0.040 to 0.067) | 7.0 (5.3 to 9.4)% |
| Participant pattern + day shift | 0.183 (0.127 to 0.228) | Not separately allocated | Not applicable |
| Participant / site | 1.465 (0.973 to 3.179) | 5.69 (3.72 to 10.68) | Not applicable |
| (Participant + day) / site | 1.809 (1.219 to 3.736) | 9.02 (6.01 to 17.03) | 90.0 (85.7 to 94.5)% |
| Fitted-curve variation is in squared log10(melanopic EDI + 0.1 lx) prediction units; ratios are unitless. The shared local-clock curve remains the baseline in every component model. Intervals are conditional hierarchical cluster-bootstrap percentiles from 2,000 replicates. In the final row, the percentage is the participant-plus-day share of heterogeneity, excluding the shared local-clock contribution. Dispersion and R² allocation are distinct estimands. | |||
Supplementary Table S6. Complementary chest fitted-curve dispersion and Shapley allocation of full-model in-sample R². The quantities, bootstrap intervals and interpretation follow Supplementary Table S5; chest and near-eye measurements remain distinct sensor-position estimands.
Supplementary Table S7. Geographic and photoperiod associations
| Overall site FDR-adjusted p |
Photoperiod
|
Latitude
|
Site-versus-latitude FDR-adjusted p | Exact fitted sample | |||
|---|---|---|---|---|---|---|---|
| Photoperiod association (95% CI) | Photoperiod FDR-adjusted p | Latitude association per 10° (95% CI) | Latitude FDR-adjusted p | ||||
| Dynamics | |||||||
| Interdaily stability | 0.228 | ×0.98 [0.94–1.02] | 0.401 | ×1.01 [0.96–1.06] | 0.903 | 0.175 | nparticipants = 141; nparticipant-days = 816 |
| Intradaily variability | 0.483 | -0.02 [-0.06–0.02] | 0.327 | -0.04 [-0.08–0.01] | 0.139 | 0.723 | nparticipants = 141; nparticipant-days = 816 |
| Level | |||||||
| Mean melEDI | <0.001 | ×1.18 [1.11–1.26] | <0.001 | ×1.15 [1.07–1.25] | 0.002 | 0.032 | nparticipants = 141; nparticipant-days = 816 |
| Brightest 10 h mean | 0.011 | ×1.24 [1.13–1.36] | <0.001 | ×1.24 [1.11–1.39] | 0.001 | 0.325 | nparticipants = 141; nparticipant-days = 816 |
| Darkest 10 h mean | <0.001 | ×1.09 [1.03–1.14] | 0.002 | ×1.04 [0.97–1.11] | 0.400 | <0.001 | nparticipants = 141; nparticipant-days = 816 |
| Duration | |||||||
| Time above 1,000 lx melEDI | 0.071 | ×1.21 [1.13–1.29] | <0.001 | ×1.03 [0.94–1.12] | 0.769 | 0.053 | nparticipants = 141; nparticipant-days = 816 |
| Time above 250 lx melEDI during wake | 0.007 | ×1.14 [1.07–1.20] | <0.001 | ×1.12 [1.04–1.20] | 0.013 | 0.053 | nparticipants = 141; nparticipant-days = 737 |
| Time below 10 lx melEDI before sleep | 0.049 | -0.13 [-0.20–-0.07] h | <0.001 | 0.00 [-0.09–0.09] h | 0.962 | 0.040 | nparticipants = 139; nparticipant-days = 655 |
| Time below 1 lx melEDI during sleep | 0.058 | ×0.99 [0.97–1.01] | 0.227 | ×1.00 [0.97–1.02] | 0.903 | 0.043 | nparticipants = 141; nparticipant-days = 778 |
| Longest continuous period above 250 lx melEDI | 0.398 | ×1.12 [1.07–1.19] | <0.001 | ×1.06 [0.99–1.13] | 0.139 | 0.626 | nparticipants = 141; nparticipant-days = 816 |
| Timing | |||||||
| Midpoint of the brightest 10 hours | <0.001 | 0.05 [-0.05–0.15] h | 0.305 | 0.19 [0.06–0.32] h | 0.013 | 0.010 | nparticipants = 141; nparticipant-days = 816 |
| Midpoint of the darkest 10 hours | 0.020 | -0.15 [-0.25–-0.05] h | 0.004 | 0.12 [-0.00–0.24] h | 0.114 | 0.043 | nparticipants = 141; nparticipant-days = 816 |
| Mean timing of exposure above 250 lx melEDI | <0.001 | 0.12 [0.03–0.21] h | 0.013 | 0.33 [0.21–0.46] h | <0.001 | <0.001 | nparticipants = 141; nparticipant-days = 742 |
| First light timing above 250 lx melEDI | 0.112 | -0.10 [-0.25–0.05] h | 0.227 | 0.02 [-0.17–0.21] h | 0.903 | 0.077 | nparticipants = 140; nparticipant-days = 727 |
| Last light timing above 250 lx melEDI | <0.001 | 0.32 [0.19–0.46] h | <0.001 | 0.46 [0.27–0.64] h | <0.001 | <0.001 | nparticipants = 141; nparticipant-days = 687 |
| Exposure history | |||||||
| melEDI dose | 0.209 | ×1.28 [1.17–1.39] | <0.001 | ×1.02 [0.91–1.13] | 0.903 | 0.156 | nparticipants = 141; nparticipant-days = 761 |
| Spectrum | |||||||
| Melanopic daylight efficacy ratio | <0.001 | 0.02 [0.02–0.03] | <0.001 | -0.01 [-0.02–-0.00] | 0.013 | 0.010 | nparticipants = 137; nparticipant-days = 702 |
| This summary combines the model-level decisions, photoperiod and latitude associations, 95% CIs, and exact fitted samples. Each displayed p-value is FDR-adjusted within its explicitly labelled complete 17-test family; bold values meet the FDR-adjusted p < 0.050 rule. Full raw p-values and test statistics remain in the detailed tables below. Exact fitted samples use italic n with participant and participant-day subscripts. For the 15 participant-day models, the participant-day count equals the number of fitted observations. The two participant-level dynamics models use one fitted observation per participant and retain the participant-day count as contributing repeated-day support. All models include nine sites. | |||||||
Supplementary Table S7. Overall-site, civil-photoperiod and absolute-latitude associations for the 17 near-eye personal light-exposure metrics. Each displayed p value is FDR-adjusted within its stated 17-test family. Site and latitude were evaluated in separate models because absolute latitude is fixed within and confounded with study site.
Supplementary Table S8. Nonlinear civil-photoperiod classifications
| Qualifying transition | Qualifying transition bracket (h) | Endpoint derivative | Interpretation | |
|---|---|---|---|---|
| Light level | ||||
| Mean melEDI | Yes | 16.10–16.20 | 0.008 (95% CI -0.111 to 0.127) | Detected increase followed by a sustained zero-compatible tail |
| Brightest 10 h mean | Yes | 15.17–15.27 | 0.059 (95% CI -0.083 to 0.201) | Detected increase followed by a sustained zero-compatible tail |
| Darkest 10 h mean | Yes | 14.86–14.96 | -0.086 (95% CI -0.216 to 0.044) | Detected increase followed by a sustained zero-compatible tail |
| Duration and continuous period | ||||
| Time above 1,000 lx melEDI | Yes | 14.86–14.96 | 0.098 (95% CI -0.176 to 0.371) | Detected increase followed by a sustained zero-compatible tail |
| Time above 250 lx melEDI during wake | Yes | 14.35–14.45 | 0.060 (95% CI -0.159 to 0.279) | Detected increase followed by a sustained zero-compatible tail |
| Time below 10 lx melEDI before sleep | No | Not applicable | -0.085 (95% CI -0.154 to -0.016) | No preceding detected increase |
| Time below 1 lx melEDI during sleep | No | Not applicable | 0.062 (95% CI -0.042 to 0.165) | No preceding detected increase |
| Longest continuous period above 250 lx melEDI | No | Not applicable | 0.041 (95% CI 0.025 to 0.058) | Increase remained detected at the recorded maximum |
| Exposure history | ||||
| melEDI dose | Yes | 14.24–14.35 | 0.070 (95% CI -0.069 to 0.209) | Detected increase followed by a sustained zero-compatible tail |
| A ‘Yes’ is the formal derivative-defined classification: the immediately preceding point has an interval wholly above zero, the next contains zero, and every later interval through the recorded maximum remains zero-compatible. Endpoint derivatives and 95% confidence intervals are on each model’s linear-predictor scale, in model-scale units per hour of civil photoperiod. | ||||
Supplementary Table S8. Derivative-based classifications for nine near-eye personal light-exposure metrics across the observed civil-photoperiod range. A qualifying transition required the preceding fitted-slope interval to be wholly above zero, the next interval to include zero and every later interval through the recorded maximum to remain zero-compatible. These classifications are descriptive and do not identify a physiological or environmental ceiling.
Supplementary Table S9. Participant-hour routine associations
| Predictor | Ratio (95% CI) | FDR-adjusted p |
|---|---|---|
| Free day versus work day | 1.45 × (1.14–1.85) | 0.004 |
| Active versus sedentary | 2.06 × (1.54–2.76) | <0.001 |
| Previous sleep duration (per hour) | 0.98 × (0.85–1.12) | 0.745 |
| Directions are free versus work day, active versus sedentary day status, and the ratio per one additional hour of previous sleep. Participant-cluster-robust 95% CIs use HC3 with 137 participants. The three p-values form one FDR-adjusted family; the null ratio is 1. | ||
Supplementary Table S9. Common-association estimates from the participant-hour analysis of Free versus Work day, Active versus Sedentary daily activity status and each additional hour of previous-night sleep duration. Ratios and participant-cluster-robust 95% confidence intervals come from the fixed-site model; the three p values form one FDR-adjusted family. Predictor-by-site differences are shown in Supplementary Figure S13.
Supplementary Table S10. Person-level evidence synthesis
| Scale | Result | FDR family | Decision | Sample | Qualification | |
|---|---|---|---|---|---|---|
| Light-exposure behaviour and awareness | Metric associations per participant-level factor SD | None retained; 4 cells were unfit for inference | 68 factor-by-metric tests | None retained | Metric-specific samples in Supplementary Table S11 | Non-retention is inconclusive rather than evidence of no association. |
| Visual light sensitivity | Metric associations per VLSQ-8 SD | Melanopic EDI dose ratio: 0.846 (0.716 to 0.999) | 9 metric tests | None retained; dose adjusted p = 0.160 | 141 participants; 761 participant-days; 9 sites | Confidence intervals and FDR decisions are separate summaries. |
| Corrected midsleep on free days | Timing per one-hour later corrected midsleep | First light timing above 250 lx melEDI: 0.381 (0.146 to 0.616) h; Midpoint of the darkest 10 hours: 0.276 (0.118 to 0.435) h; Midpoint of the brightest 10 hours: 0.205 (0.045 to 0.366) h | 5 MCTQ timing outcomes | 3 associations retained | 139 to 140 participants; 722 to 810 participant-days; 9 sites | The two chronotype instruments are analysed separately; associations do not identify causal direction. |
| Morningness-eveningness preference | Timing per 10 points greater morning preference | First light timing above 250 lx melEDI: -0.444 (-0.699 to -0.189) h; Midpoint of the darkest 10 hours: -0.314 (-0.487 to -0.142) h; Midpoint of the brightest 10 hours: -0.278 (-0.451 to -0.105) h | 5 MEQ timing outcomes | 3 associations retained | 140 to 141 participants; 727 to 816 participant-days; 9 sites | The two chronotype instruments are analysed separately; associations do not identify causal direction. |
| Age | Metric associations per 10 years | Brightest 10 h mean: 1.31× (1.09–1.58); Time above 1,000 lx melEDI: 1.27× (1.11–1.45); melEDI dose: 1.31× (1.09–1.56) | 17 near-eye metric tests | 3 associations retained | 141 participants; 761 to 816 participant-days; 9 sites | Cross-sectional associations may reflect cohort, occupation, behaviour or other confounding. |
| Metric-level biological sex | Female minus Male | None retained | 17 near-eye metric tests | None retained | Metric-specific samples in Supplementary Table S14 | Biological sex and gender were recorded separately; gender was not analysed. |
| Biological-sex-specific daily curve | Complete curve and activity-complete sensitivity | Complete available-data curve: FDR-adjusted p = 0.028. Activity-complete adjusted curve: exploratory global curve not supported. | Global complete-curve tests and separate sensitivity decisions | Analysis-specific global decisions | 141 participants; 816 participant-days; 9 sites; 37,756 observations | Restriction and activity adjustment cannot be disentangled as mechanisms. Clock-specific intervals are pointwise. |
Supplementary Table S10. Summary of person-level results in the near-eye analyses. Each row identifies the analysis-specific FDR-correction set or decision structure applied to that result. Results that did not meet the applicable FDR criterion are inconclusive rather than evidence of no association. Four light-behaviour sleep-environment cells were unfit for inference. The two chronotype instruments were analysed separately. Biological sex and gender were recorded separately; gender was not analysed. The complete available-data curve difference was attenuated and not retained in the activity-complete near-eye analysis.
Supplementary Table S11. Light-exposure behaviour and awareness
| F2 | F3 | F4 | F5 | |
|---|---|---|---|---|
| Interdaily stability | OR 1.028 (0.956–1.106) Raw p = 0.445; FDR-adjusted p = 0.658 |
OR 0.931 (0.868–0.999) Raw p = 0.042; FDR-adjusted p = 0.260 |
OR 0.975 (0.906–1.050) Raw p = 0.489; FDR-adjusted p = 0.679 |
OR 1.089 (1.011–1.174) Raw p = 0.021; FDR-adjusted p = 0.202 |
| Intradaily variability | -0.057 (-0.124–+0.009) Raw p = 0.083; FDR-adjusted p = 0.351 |
-0.001 (-0.068–+0.065) Raw p = 0.971; FDR-adjusted p = 0.978 |
+0.001 (-0.068–+0.069) Raw p = 0.978; FDR-adjusted p = 0.978 |
+0.057 (-0.013–+0.127) Raw p = 0.099; FDR-adjusted p = 0.362 |
| Mean melEDI | ×1.092 (0.965–1.235) Raw p = 0.150; FDR-adjusted p = 0.379 |
×0.917 (0.813–1.034) Raw p = 0.146; FDR-adjusted p = 0.379 |
×0.891 (0.787–1.009) Raw p = 0.060; FDR-adjusted p = 0.313 |
×0.941 (0.827–1.070) Raw p = 0.336; FDR-adjusted p = 0.585 |
| Brightest 10 h mean | ×1.204 (1.008–1.439) Raw p = 0.035; FDR-adjusted p = 0.260 |
×0.888 (0.745–1.058) Raw p = 0.169; FDR-adjusted p = 0.384 |
×0.906 (0.756–1.087) Raw p = 0.272; FDR-adjusted p = 0.545 |
×0.931 (0.772–1.123) Raw p = 0.436; FDR-adjusted p = 0.658 |
| Darkest 10 h mean | ×0.995 (0.905–1.094) Raw p = 0.917; FDR-adjusted p = 0.958 |
×0.956 (0.871–1.049) Raw p = 0.322; FDR-adjusted p = 0.577 |
×0.921 (0.838–1.013) Raw p = 0.080; FDR-adjusted p = 0.351 |
×0.970 (0.879–1.070) Raw p = 0.526; FDR-adjusted p = 0.716 |
| Time above 1,000 lx melEDI | ×1.234 (1.084–1.405) Raw p = 0.002; FDR-adjusted p = 0.124 |
×0.895 (0.785–1.020) Raw p = 0.097; FDR-adjusted p = 0.362 |
×0.911 (0.797–1.043) Raw p = 0.178; FDR-adjusted p = 0.390 |
×0.831 (0.725–0.953) Raw p = 0.009; FDR-adjusted p = 0.169 |
| Time above 250 lx melEDI during wake | ×1.122 (1.006–1.252) Raw p = 0.041; FDR-adjusted p = 0.260 |
×0.907 (0.814–1.010) Raw p = 0.075; FDR-adjusted p = 0.351 |
×0.953 (0.852–1.065) Raw p = 0.397; FDR-adjusted p = 0.614 |
×0.946 (0.843–1.061) Raw p = 0.345; FDR-adjusted p = 0.586 |
| Time below 10 lx melEDI before sleep | -0.005 h (-0.135–+0.124 h) Raw p = 0.930; FDR-adjusted p = 0.958 |
+0.052 h (-0.073–+0.177 h) Raw p = 0.392; FDR-adjusted p = 0.614 |
+0.028 h (-0.104–+0.159 h) Raw p = 0.654; FDR-adjusted p = 0.781 |
-0.031 h (-0.167–+0.105 h) Raw p = 0.646; FDR-adjusted p = 0.781 |
| Time below 1 lx melEDI during sleep | Unfit for inference Estimate and p-values suppressed from the reader display |
Unfit for inference Estimate and p-values suppressed from the reader display |
Unfit for inference Estimate and p-values suppressed from the reader display |
Unfit for inference Estimate and p-values suppressed from the reader display |
| Longest continuous period above 250 lx melEDI | ×1.117 (1.007–1.238) Raw p = 0.031; FDR-adjusted p = 0.260 |
×0.924 (0.835–1.023) Raw p = 0.117; FDR-adjusted p = 0.375 |
×0.933 (0.840–1.037) Raw p = 0.185; FDR-adjusted p = 0.393 |
×0.945 (0.847–1.053) Raw p = 0.287; FDR-adjusted p = 0.557 |
| Associations are reported per one participant-level SD of the LEBA score with 95% CIs. Raw p has no separate bolding rule; FDR-adjusted p is bold only at alpha = 0.050 across all 68 tests. Sleep-environment cells are unfit for inference and suppressed. | ||||
| F2 | F3 | F4 | F5 | |
|---|---|---|---|---|
| Midpoint of the brightest 10 hours | +0.049 h (-0.132–+0.229 h) Raw p = 0.584; FDR-adjusted p = 0.747 |
+0.133 h (-0.042–+0.309 h) Raw p = 0.124; FDR-adjusted p = 0.375 |
+0.030 h (-0.153–+0.213 h) Raw p = 0.740; FDR-adjusted p = 0.868 |
-0.083 h (-0.270–+0.105 h) Raw p = 0.371; FDR-adjusted p = 0.601 |
| Midpoint of the darkest 10 hours | -0.136 h (-0.317–+0.044 h) Raw p = 0.127; FDR-adjusted p = 0.375 |
+0.080 h (-0.097–+0.258 h) Raw p = 0.358; FDR-adjusted p = 0.594 |
-0.020 h (-0.204–+0.164 h) Raw p = 0.825; FDR-adjusted p = 0.935 |
+0.132 h (-0.056–+0.320 h) Raw p = 0.156; FDR-adjusted p = 0.379 |
| Mean timing of exposure above 250 lx melEDI | +0.020 h (-0.152–+0.192 h) Raw p = 0.819; FDR-adjusted p = 0.935 |
+0.086 h (-0.081–+0.253 h) Raw p = 0.295; FDR-adjusted p = 0.558 |
-0.097 h (-0.267–+0.074 h) Raw p = 0.247; FDR-adjusted p = 0.510 |
-0.166 h (-0.339–+0.008 h) Raw p = 0.053; FDR-adjusted p = 0.301 |
| First light timing above 250 lx melEDI | -0.219 h (-0.489–+0.052 h) Raw p = 0.101; FDR-adjusted p = 0.362 |
+0.324 h (+0.062–+0.585 h) Raw p = 0.013; FDR-adjusted p = 0.179 |
+0.019 h (-0.252–+0.291 h) Raw p = 0.887; FDR-adjusted p = 0.958 |
-0.097 h (-0.380–+0.185 h) Raw p = 0.486; FDR-adjusted p = 0.679 |
| Last light timing above 250 lx melEDI | +0.308 h (+0.043–+0.573 h) Raw p = 0.020; FDR-adjusted p = 0.202 |
-0.066 h (-0.328–+0.196 h) Raw p = 0.615; FDR-adjusted p = 0.760 |
-0.011 h (-0.280–+0.259 h) Raw p = 0.927; FDR-adjusted p = 0.958 |
-0.081 h (-0.361–+0.200 h) Raw p = 0.558; FDR-adjusted p = 0.743 |
| melEDI dose | ×1.278 (1.079–1.514) Raw p = 0.004; FDR-adjusted p = 0.124 |
×0.885 (0.748–1.048) Raw p = 0.143; FDR-adjusted p = 0.379 |
×0.872 (0.732–1.038) Raw p = 0.112; FDR-adjusted p = 0.375 |
×0.881 (0.736–1.054) Raw p = 0.153; FDR-adjusted p = 0.379 |
| Melanopic daylight efficacy ratio | +0.004 (-0.011–+0.019) Raw p = 0.586; FDR-adjusted p = 0.747 |
-0.004 (-0.019–+0.011) Raw p = 0.593; FDR-adjusted p = 0.747 |
-0.010 (-0.026–+0.005) Raw p = 0.162; FDR-adjusted p = 0.380 |
-0.020 (-0.035–-0.004) Raw p = 0.010; FDR-adjusted p = 0.169 |
| Associations are reported per one participant-level SD of the LEBA score with 95% CIs. Raw p has no separate bolding rule; FDR-adjusted p is bold only at alpha = 0.050 across all 68 tests. Sleep-environment cells are unfit for inference and suppressed. | ||||
Supplementary Table S12. Visual light sensitivity
| Metric | Scale | Association per VLSQ-8 SD (95% CI) | Raw p | FDR-adjusted p | Participants / participant-days / sites |
|---|---|---|---|---|---|
| Mean melEDI | Ratio (percentage change) | ×0.915 (0.811–1.031) | 0.147 | 0.221 | 141 / 816 / 9 |
| Brightest 10 h mean | Ratio (percentage change) | ×0.851 (0.716–1.013) | 0.071 | 0.160 | 141 / 816 / 9 |
| Darkest 10 h mean | Ratio (percentage change) | ×1.024 (0.934–1.123) | 0.612 | 0.689 | 141 / 816 / 9 |
| Time above 1,000 lx melEDI | Ratio (percentage change) | ×0.876 (0.765–1.002) | 0.056 | 0.160 | 141 / 816 / 9 |
| Time above 250 lx melEDI during wake | Ratio (percentage change) | ×0.900 (0.806–1.005) | 0.063 | 0.160 | 141 / 737 / 9 |
| Time below 10 lx melEDI before sleep | Difference in hours | +0.063 h (-0.062–+0.188 h) | 0.328 | 0.422 | 139 / 655 / 9 |
| Time below 1 lx melEDI during sleep | Ratio (percentage change) | ×0.998 (0.964–1.033) | 0.903 | 0.903 | 141 / 778 / 9 |
| Longest continuous period above 250 lx melEDI | Ratio (percentage change) | ×0.917 (0.828–1.014) | 0.093 | 0.167 | 141 / 816 / 9 |
| melEDI dose | Ratio (percentage change) | ×0.846 (0.716–0.999) | 0.051 | 0.160 | 141 / 761 / 9 |
| Associations compare scores separated by one participant-level SD (5.540 VLSQ-8 points). The hour-scale row is an absolute difference; ratio rows can be read as percentage changes. Intervals are two-sided 95% Wald CIs. FDR adjustment is across all nine metrics; adjusted p-values would be bold at 0.050. | |||||
Supplementary Table S13. Chronotype and timing
| Metric | Instrument | Signed association, h (95% CI) | Raw p | FDR-adjusted p | Fitted sample: participants / days / observations / hours / sites |
|---|---|---|---|---|---|
| Midpoint of the brightest 10 hours | MCTQ MSFsc | +0.205 (+0.045 to +0.366) | 0.010 | 0.017 | 140 / 810 / 810 / 18711.7 h / 9 |
| Midpoint of the brightest 10 hours | MEQ | -0.278 (-0.451 to -0.105) | 0.001 | 0.002 | 141 / 816 / 816 / 18851.0 h / 9 |
| Midpoint of the darkest 10 hours | MCTQ MSFsc | +0.276 (+0.118 to +0.435) | <0.001 | 0.003 | 140 / 810 / 810 / 18711.7 h / 9 |
| Midpoint of the darkest 10 hours | MEQ | -0.314 (-0.487 to -0.142) | <0.001 | 0.001 | 141 / 816 / 816 / 18851.0 h / 9 |
| First light timing above 250 lx melEDI | MCTQ MSFsc | +0.381 (+0.146 to +0.616) | 0.001 | 0.003 | 139 / 722 / 722 / 16716.3 h / 9 |
| First light timing above 250 lx melEDI | MEQ | -0.444 (-0.699 to -0.189) | <0.001 | 0.001 | 140 / 727 / 727 / 16832.5 h / 9 |
| Last light timing above 250 lx melEDI | MCTQ MSFsc | -0.025 (-0.264 to +0.214) | 0.811 | 0.811 | 140 / 683 / 683 / 15900.8 h / 9 |
| Last light timing above 250 lx melEDI | MEQ | +0.029 (-0.236 to +0.294) | 0.814 | 0.814 | 141 / 687 / 687 / 15995.0 h / 9 |
| Midpoint of the longest continuous period above 250 lx melEDI | MCTQ MSFsc | +0.161 (-0.113 to +0.434) | 0.227 | 0.284 | 131 / 478 / 478 / 11325.5 h / 9 |
| Midpoint of the longest continuous period above 250 lx melEDI | MEQ | -0.228 (-0.521 to +0.064) | 0.108 | 0.135 | 132 / 482 / 482 / 11419.8 h / 9 |
| MCTQ associations are per one-hour later MSFsc; MEQ associations are per 10 points greater morning preference. Positive associations indicate later timing and negative associations earlier. Intervals are 95% Wald CIs. Raw p-values are bold when raw p < 0.050; adjusted p-values are bold when FDR-adjusted p < 0.050 within the instrument-specific five-outcome family. | |||||
Supplementary Table S14. Age and biological sex
| Placement and role | Predictor | Metric | Practical association (95% CI) | Raw p | FDR-adjusted p | Sample |
|---|---|---|---|---|---|---|
| Near eye (primary) | Age, per 10 years | Brightest 10 h mean | 1.31× (1.09–1.58) | 0.003 | 0.018 | 141 participants; 816 participant-days/observations |
| Near eye (primary) | Age, per 10 years | Time above 1,000 lx melEDI | 1.27× (1.11–1.45) | <0.001 | 0.009 | 141 participants; 816 participant-days/observations |
| Near eye (primary) | Age, per 10 years | melEDI dose | 1.31× (1.09–1.56) | 0.003 | 0.018 | 141 participants; 761 participant-days/observations |
| Chest (complementary) | Age, per 10 years | Mean melEDI | 1.16× (1.04–1.30) | 0.006 | 0.017 | 154 participants; 902 participant-days/observations |
| Chest (complementary) | Age, per 10 years | Brightest 10 h mean | 1.35× (1.15–1.57) | <0.001 | <0.001 | 154 participants; 902 participant-days/observations |
| Chest (complementary) | Age, per 10 years | Time above 1,000 lx melEDI | 1.31× (1.18–1.46) | <0.001 | <0.001 | 154 participants; 902 participant-days/observations |
| Chest (complementary) | Age, per 10 years | Time above 250 lx melEDI during wake | 1.16× (1.06–1.26) | 0.001 | 0.004 | 154 participants; 818 participant-days/observations |
| Chest (complementary) | Age, per 10 years | Longest continuous period above 250 lx melEDI | 1.18× (1.09–1.27) | <0.001 | <0.001 | 154 participants; 902 participant-days/observations |
| Chest (complementary) | Age, per 10 years | melEDI dose | 1.40× (1.21–1.61) | <0.001 | <0.001 | 154 participants; 851 participant-days/observations |
| Chest (complementary) | Measured biological sex, Female minus Male | Mean melEDI | 0.74× (0.60–0.92) | 0.006 | 0.048 | 154 participants; 902 participant-days/observations |
| Chest (complementary) | Measured biological sex, Female minus Male | Darkest 10 h mean | 0.76× (0.65–0.90) | <0.001 | 0.016 | 154 participants; 902 participant-days/observations |
| Associations are site-adjusted estimates per 10-year age increase or Female minus Male. Ratios are back-transformed to the practical scale. Each FDR-adjusted p-value belongs to its sensor-position- and predictor-specific complete 17-test family; bold values meet the FDR-adjusted p < 0.050 rule. Samples give the exact fitted participants and participant-day observations for these retained daily-response results. | ||||||
Supplementary Table S15. Biological-sex-specific daily curves
| Role | Test | F statistic | Numerator df | Denominator df | Raw p | FDR-adjusted p | Support | |
|---|---|---|---|---|---|---|---|---|
| Near eye | Primary | Complete Female-minus-Male 24-hour curve | 20.946 | 9.692 | 131 | 0.028 | 0.028 | Supported |
| Chest | Complementary | Complete Female-minus-Male 24-hour curve | 4.876 | 1.003 | 152 | 0.029 | 0.029 | Supported |
| Primary near-eye fitted sample: 141 participants, 816 participant-days, 37,756 30-minute observations, and 9 sites. Complementary chest fitted sample: 154 participants, 902 participant-days, 41,842 30-minute observations, and 8 sites. | ||||||||
| Each row is one joint complete-curve test. Raw p is bold at raw p < 0.050; FDR-adjusted p is bold independently at adjusted p < 0.050. Each labelled global family contains one test, so the stored raw and adjusted values coincide. | ||||||||