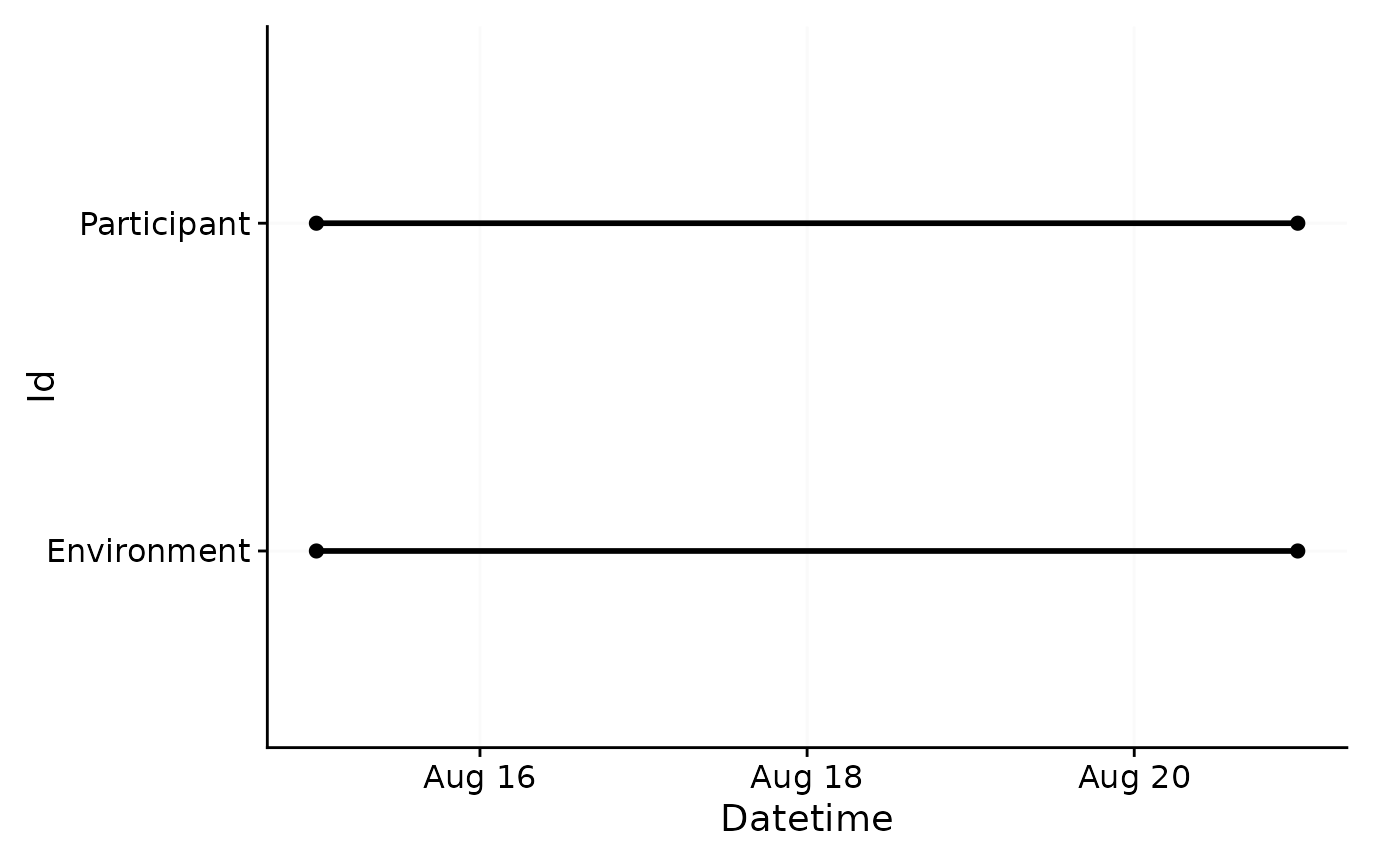
Plot an overview of dataset intervals with implicit missing data
Source:R/gg_overview.R
gg_overview.RdPlot an overview of dataset intervals with implicit missing data
Usage
gg_overview(
  dataset,
  Datetime.colname = Datetime,
  Id.colname = Id,
  gap.data = NULL,
  ...,
  interactive = FALSE
)
Arguments
- dataset
A light logger dataset. Expects a
dataframe. If not imported by LightLogR, take care to choose a sensible variable for thex.axis..- Datetime.colname
column name that contains the datetime. Defaults to
"Datetime"which is automatically correct for data imported with LightLogR. Expects asymbol. Needs to be part of thedataset.- Id.colname
The column name of the Id column (default is
Id), needs to be in thedataset. This is also used as the y-axis variable and is the minimum grouping variable.- gap.data
Optionally provide a
tibblewithstartandendDatetimesof gaps per group. If not provided, the function usesgap_finder()to calculate implicit missing data. This might be computationally intensive for large datasets and many missing data. In these cases it can make sense to calculate those gaps beforehand and provide them to the function. If an emptytibble(tibble::tibble()) is provided, the function will just plot the start and end dates of the dataset, which is computationally very fast at the cost of additional info.- ...
Additional arguments given to the main
ggplot2::aes()used for styling depending on data within thedataset- interactive
Should the plot be interactive? Expects a
logical. Defaults toFALSE.
Examples
sample.data.environment %>% gg_overview()
