gg_day() will create a simple ggplot for every data in a dataset. The
result can further be manipulated like any ggplot. This will be sensible to
refine styling or guides.
Usage
gg_day(
  dataset,
  y.axis = MEDI,
  geom = "point",
  start.date = NULL,
  end.date = NULL,
  x.axis = Datetime,
  aes_col = NULL,
  aes_fill = NULL,
  group = Id,
  scales = c("fixed", "free_x", "free_y", "free"),
  x.axis.breaks = hms::hms(hours = seq(0, 24, by = 3)),
  y.axis.breaks = c(-10^(5:0), 0, 10^(0:5)),
  y.scale = "symlog",
  y.scale.sc = FALSE,
  x.axis.label = "Local time (HH:MM)",
  y.axis.label = "Melanopic EDI (lx)",
  format.day = "%d/%m",
  title = NULL,
  subtitle = NULL,
  interactive = FALSE,
  facetting = TRUE,
  jco_color = TRUE,
  ...
)
Arguments
- dataset
A light logger dataset. Expects a
dataframe. If not imported by LightLogR, take care to choose a sensible variable for thex.axis..- geom
What geom should be used for visualization? Expects a
character"point"forggplot2::geom_point()"line"forggplot2::geom_line()"ribbon"forggplot2::geom_ribbon()as the value is just input into the
geom_function from ggplot2, other variants work as well, but are not extensively tested.
- start.date, end.date
Choose an optional start or end date within your
dataset. Expects adate, which can also be acharacterthat is interpretable as a date, e.g.,"2023-06-03". If you need a Datetime or want to cut specific times of each day, use thefilter_Datetime()function. Defaults toNULL, which means that the plot starts/ends with the earliest/latest date within thedataset.- x.axis, y.axis
column name that contains the datetime (x, defaults to
"Datetime"which is automatically correct for data imported with LightLogR) and the dependent variable (y, defaults to"MEDI", or melanopic EDI, which is a standard measure of stimulus strength for the nonvisual effects of light). Expects asymbol. Needs to be part of thedataset.- aes_col, aes_fill
optional arguments that define separate sets and colors or fills them. Expects anything that works with the layer data
ggplot2::aes(). The default color palette can be overwritten outside the function (see examples).- group
Optional column name that defines separate sets. Useful for certain geoms like
boxplot.Expects anything that works with the layer dataggplot2::aes()- scales
For
ggplot2::facet_wrap(), should scales be "fixed", "free" or free in one dimension ("free_y" is the default). Expects acharacter.- x.axis.breaks, y.axis.breaks
Where should breaks occur on the x and y.axis? Expects a
numeric vectorwith all the breaks. If you want to activate the default behaviour of ggplot2, you need to put inggplot2::waiver().- y.scale
How should the y-axis be scaled?
Defaults to
"symlog", which is a logarithmic scale that can also handle negative values."log10"would be a straight logarithmic scale, but cannot handle negative values."identity"does nothing (continuous scaling).a transforming function, such as
symlog_trans()orscales::identity_trans(), which allow for more control.
- y.scale.sc
logicalfor whether scientific notation shall be used. Defaults toFALSE.- x.axis.label, y.axis.label
labels for the x- and y-axis. Expects a
character.- format.day
Label for each day. Default is
%d/%m, which shows the day and month. Expects acharacter. For an overview of sensible options look atbase::strptime()- title
Plot title. Expects a
character.- subtitle
Plot subtitle. Expects a
character.- interactive
Should the plot be interactive? Expects a
logical. Defaults toFALSE.- facetting
Should an automated facet by day be applied? Default is
TRUEand uses theDay.datavariable that the function also creates if not present.- jco_color
Should the
ggsci::scale_color_jco()color palette be used? Defaults toTRUE.- ...
Other options that get passed to the main geom function. Can be used to adjust to adjust size, linewidth, or linetype.
Details
Besides plotting, the function creates two new variables from the given
Datetime:
Day.datais a factor that is used for facetting withggplot2::facet_wrap(). Make sure to use this variable, if you change the faceting manually. Also, the function checks, whether this variable already exists. If it does, it will only convert it to a factor and do the faceting on that variable.Timeis anhmscreated withhms::as_hms()that is used for the x.axis
The default scaling of the y-axis is a symlog scale, which is a logarithmic
scale that only starts scaling after a given threshold (default = 0). This
enables values of 0 in the plot, which are common in light logger data, and
even enables negative values, which might be sensible for non-light data. See
symlog_trans() for details on tweaking this scale. The scale can also be
changed to a normal or logarithmic scale - see the y.scale argument for more.
The default scaling of the color and fill scales is discrete, with the
ggsci::scale_color_jco() and ggsci::scale_fill_jco() scales. To use a
continuous scale, use the jco_color = FALSE setting. Both fill and
color aesthetics are set to NULL by default. For most geoms, this is not
important, but geoms that automatically use those aesthetics (like
geom_bin2d, where fill = stat(count)) are affected by this. Manually adding
the required aesthetic (like aes_fill = ggplot2::stat(count) will fix
this).
Examples
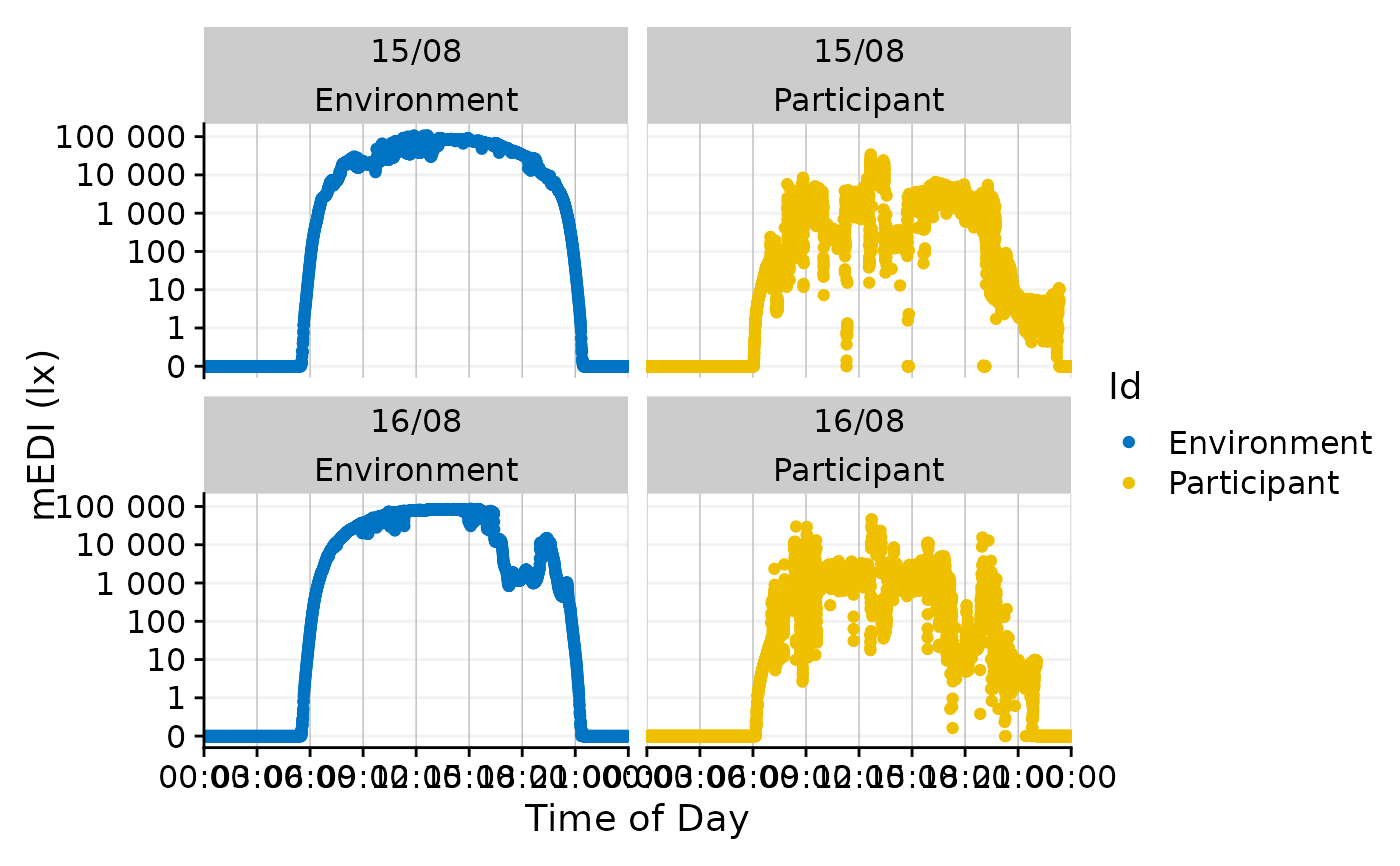
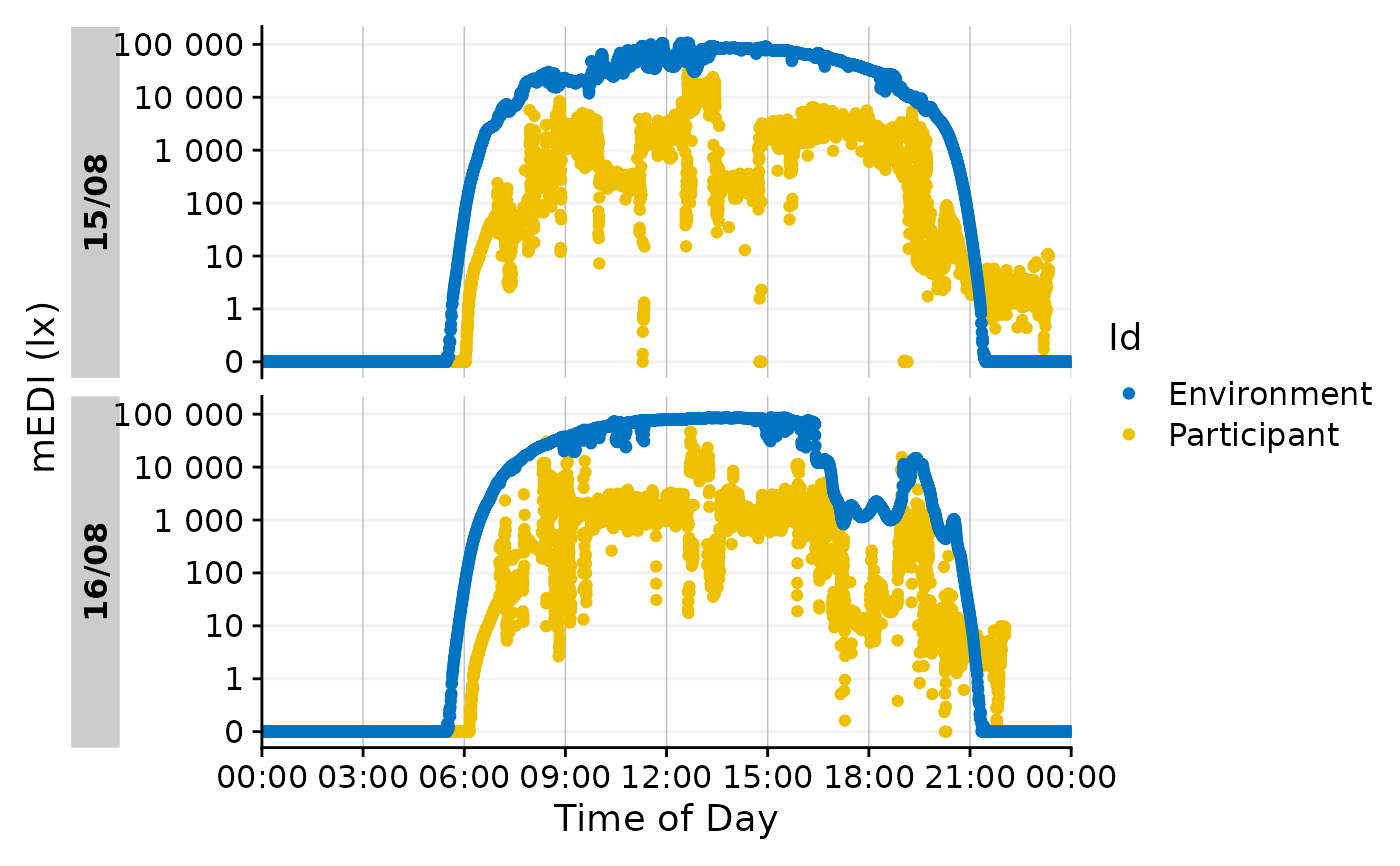
#use `col`for separation of different sets
plot <- gg_day(
sample.data.environment,
scales = "fixed",
end.date = "2023-08-31",
y.axis.label = "mEDI (lx)",
aes_col = Id)
#> Only Dates will be used from start.date and end.date input. If you also want to set Datetimes or Times, consider using the `filter_Datetime()` function instead.
plot
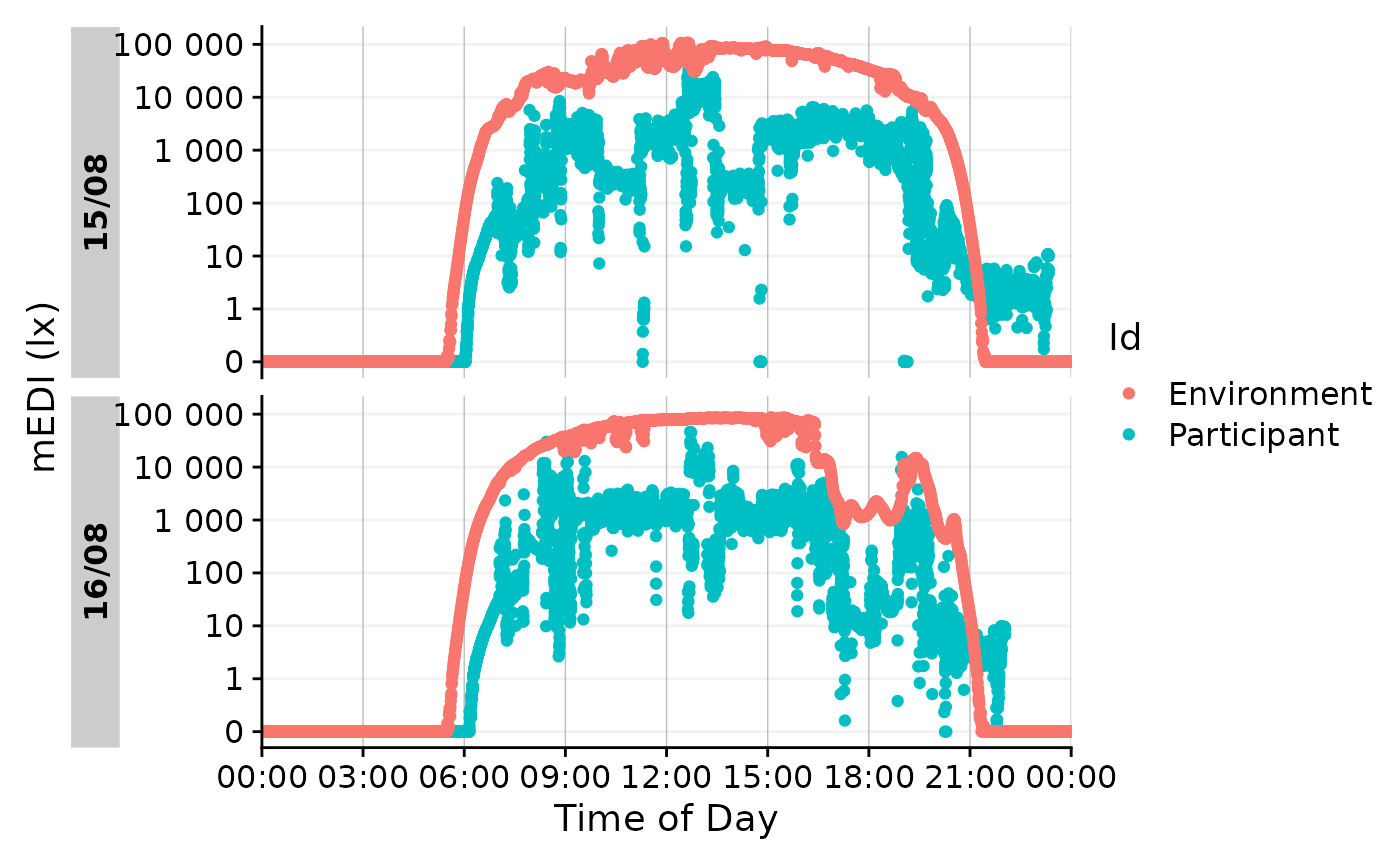
 #you can easily overwrite the color scale afterwards
plot + ggplot2::scale_color_discrete()
#> Scale for colour is already present.
#> Adding another scale for colour, which will replace the existing scale.
#you can easily overwrite the color scale afterwards
plot + ggplot2::scale_color_discrete()
#> Scale for colour is already present.
#> Adding another scale for colour, which will replace the existing scale.
 #or change the facetting
plot + ggplot2::facet_wrap(~Day.data + Id)
#or change the facetting
plot + ggplot2::facet_wrap(~Day.data + Id)