install.packages("LightLogR")
library(LightLogR)LightLogR newsletter
January 2026, Edition #02
We are back with another dose of LightLogR updates, now under a bright high noon sky.
LightLogR 0.10.0 High noon is here
The newest release, LightLogR 0.10.0 High noon, brings mid-day clarity to your analyses with improvements across the package. Thank you for the continued feedback and energy that made this possible.
Highlights in v0.10.0 High noon
Switch between the tabs to see a selecton of new additions to the package.
Summary table with helpful overview and common light exposure metrics
data |> summary_table()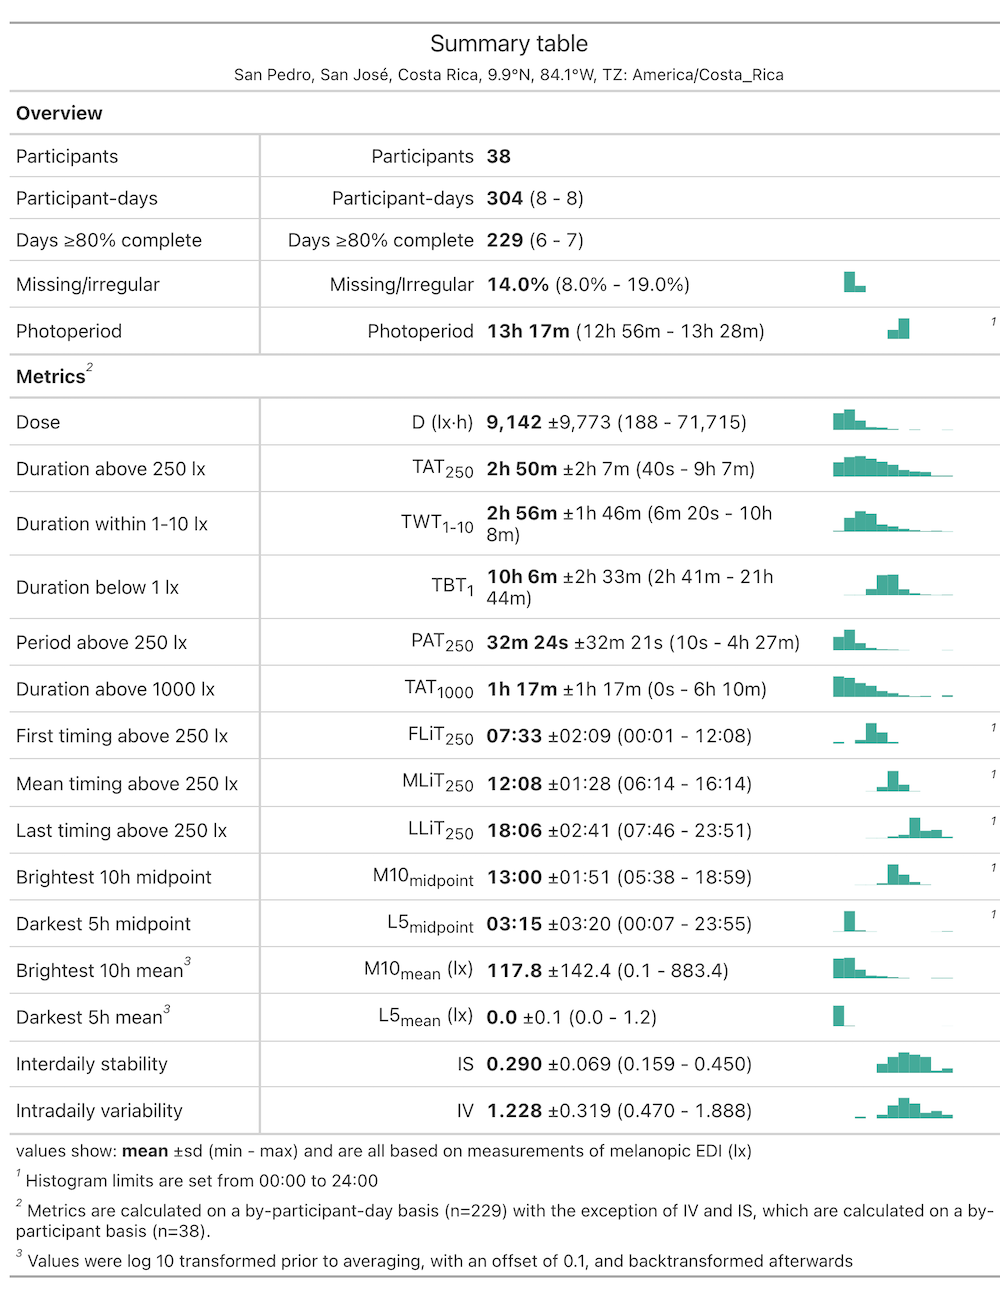
Access overview and metric functions separately with summary_overview() and summary_metrics()
Quickly select individuals/groups based on number, summary metric, or randomly:
#return the three topmost groups
data |> sample_groups(n=3)
#return a random group
data |> sample_groups(sample="random")#return the group with the highest average melanopic EDI
data |> sample_groups(order.by = mean(MEDI)) #return all groups with a median MEDI value above 1000
data |> sample_groups(condition = median(MEDI) > 1000) Combine these arguments to get quick access to exactly the participants and groups you need
Support for multiple file format versions
File formats evolve over time. LightLogR is now ready when things change, e.g., through a software update. Simply specify the version you need.
import$VEET(file, version = "2.1.7")How do you know which formats are available and how they differ? And which one is the default when you don’t specify anything? Look under supported_versions()
supported_versions(device = "VEET") 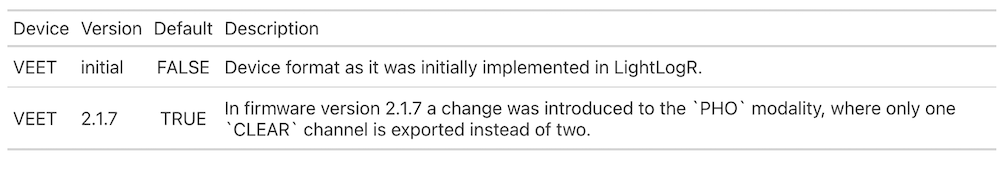
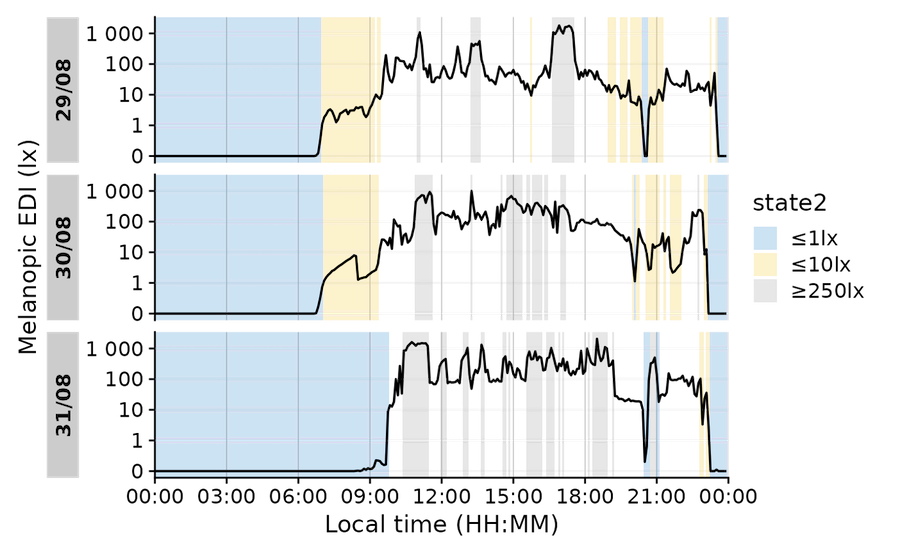
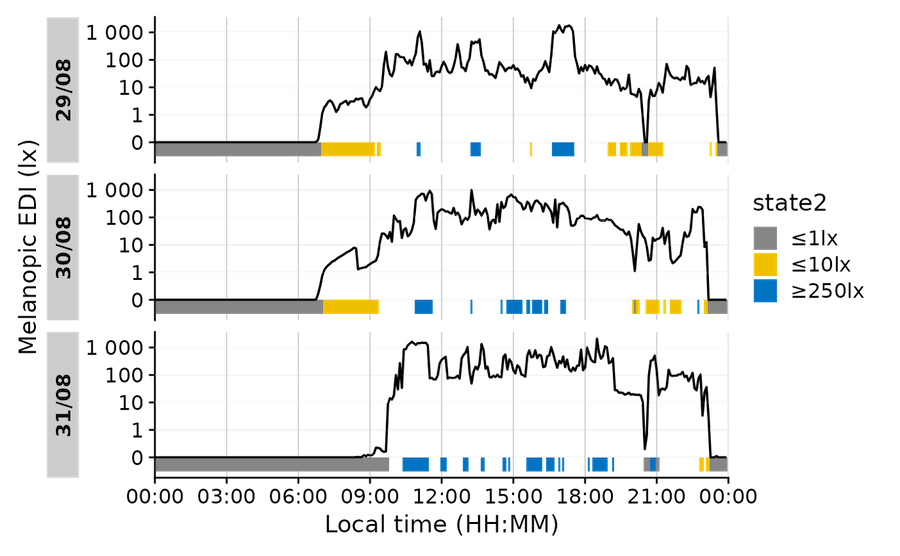
Individual heights for states
Before 0.10.0 High noon, states and photoperiods would always be displayed as panel-filling. In some cases this could be confusing. Now, states can have their ymin and ymax aesthetic to add the information where you want it specifically, add states and photoperiods at the same time, or even add multiple states with multiple heights.
Switch between the tabs to see the difference.
Time of day is circular, but datetimes are not. This regularly leads to problems when calculating with them, because what happens mathematically, e.g., during averaging, is not always what we intend. E.g., consider these datetimes:
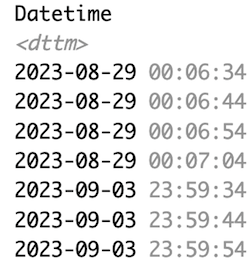
Depending on what these indicate, we might need a linear or a circular representation of time-of-day. Let’s say they indicate bedtimes, some after, and some before midnight. We try both approaches to calculate the average bedtime. Switch between the tabs to see the difference.
data |>
  Datetime2Time() |>
  summarize_numeric()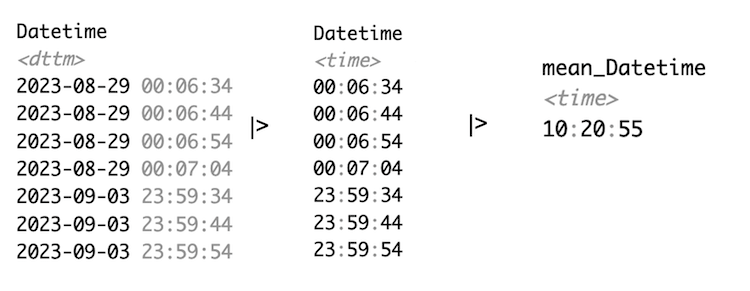
In linear time, time-of-day is stored as seconds from midnight. Accordingly, the average is around 10 in the morning - which is not sensible in the context of this example. Thus we have to switch to circular time.
Note that we converted datetimes to times prior to averaging. If we had averaged datetimes, the date-component would have added another layer of complexity.
data |>
  Datetime2Time(circular = TRUE) |>
  summarize_numeric() |> Circular2Time()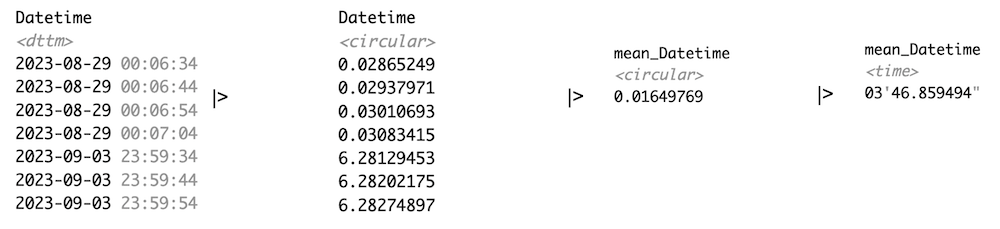
Circular time is represented as angles on a circular system. When these are averaged, the distance between two points on the circle is relevant, not where the circle starts or ends. Thus, we get a sensible average, which, in this case, is about 3-4 minutes past midnight.
Note that LightLogR 0.10.0 High noon uses the circular package to implement this functionality.
Explore the release notes
Read the full changelog in the LightLogR news section.
Open and reproducible analysis of light exposure and visual experience data
In October, we started a course series on the Open and reproducible analysis of light exposure and visual experience data, covering beginner and advanced levels. The course is targeted at all researchers that touch base with personal light exposure and visual experience data collected from wearable devices. The goal is to remove friction around common tasks when preparing analyses and combining streams of data through standardized pipelines and reproducible methods. While LightLogR sits at the center of this course, it goes beyond the package to explain tidy frameworks, common approaches (and pitfalls) in analysis, and gathers a research community developing and devoliping standards, instead of reinventing the wheel with every project.
The course consists of dynamic (live) and static analysis scripts that cover all the bases. Live tutorials run a self‑contained version of R in your browser - no setup required - with only minor functional limitations. Static tutorials provide the complete script exactly as you would run it in a local R installation.
In the spirit of openness and reproducibility, the course is completely free of charge, does not require a sign-in, and can be done at any time - just visit the course website. If you would like some additional input on the principles, the tutorials, and a walkthrough, you can register for the free webinar installments of the course:
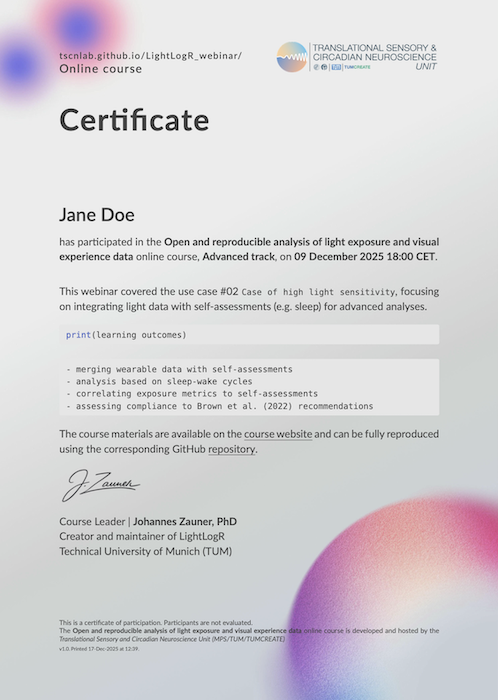
Thank you to our learners
A special note of appreciation: we sent out 122 certificates to participants from the beginner and advanced webinars. Thank you for your dedication to open, reproducible research and for being part of this growing community.
LightLogR in publications and projects
We are happy to share publications and activities from 2025 that use or feature LightLogR:
- Biller & Zauner et al.: Physiologically-relevant light exposure and light behaviour in Switzerland and Malaysia
- Guidolin et al.: Collecting, detecting, and handling non-wear intervals in longitudinal light exposure data
- Hartmeyer et al.: Multi-Wearable Approach for Monitoring Diurnal Light Exposure and Body Rhythms in Nightshift Workers
- Fazlali et al.: Sex and Seasonal Variations in Melatonin Suppression and Alerting Response to Light
- Lazar et al.: Afternoon to early evening bright light exposure reduces later melatonin production in adolescents
- Murukesu et al.: A day in Daylight (dashboard)
- Zauner & Stefani et al.(in print): Auxiliary data, quality assurance and quality control for wearable light loggers and optical radiation dosimeters
- Zauner et al.: How to Deal With Darkness: Modeling and Visualization of Zero-Inflated Personal Light Exposure Data on a Logarithmic Scale
- Zauner et al.: LightLogR: Reproducible analysis of personal light exposure data
NoteAre you using LightLogR in your paper?
Please let us know by writing an email to us. We will add it to a bibliography on LightLogR’s documentation webpage and feature it in the next newsletter.
We are thrilled to see LightLogR empowering research teams worldwide and look forward to sharing more tools, courses, and community news soon.
The “big build”: Building a commons for light exposure data
![]()
Our “big build” the Global Light Commons (a GLEE initiative) has been busy meeting with light enthusiasts across continents to understand the needs of our community globally.
Our Vision
Our goal is to build a shared, open infrastructure for light exposure data. We want to ensure this data is:
- Findable and accessible to all.
- Usable across different sectors.
- Reproducible for rigorous science, informed policy, and improved public health.
To work toward this vision, we are developing the technical foundations of the Global Light Commons.
Global Light Commons Infrastructure
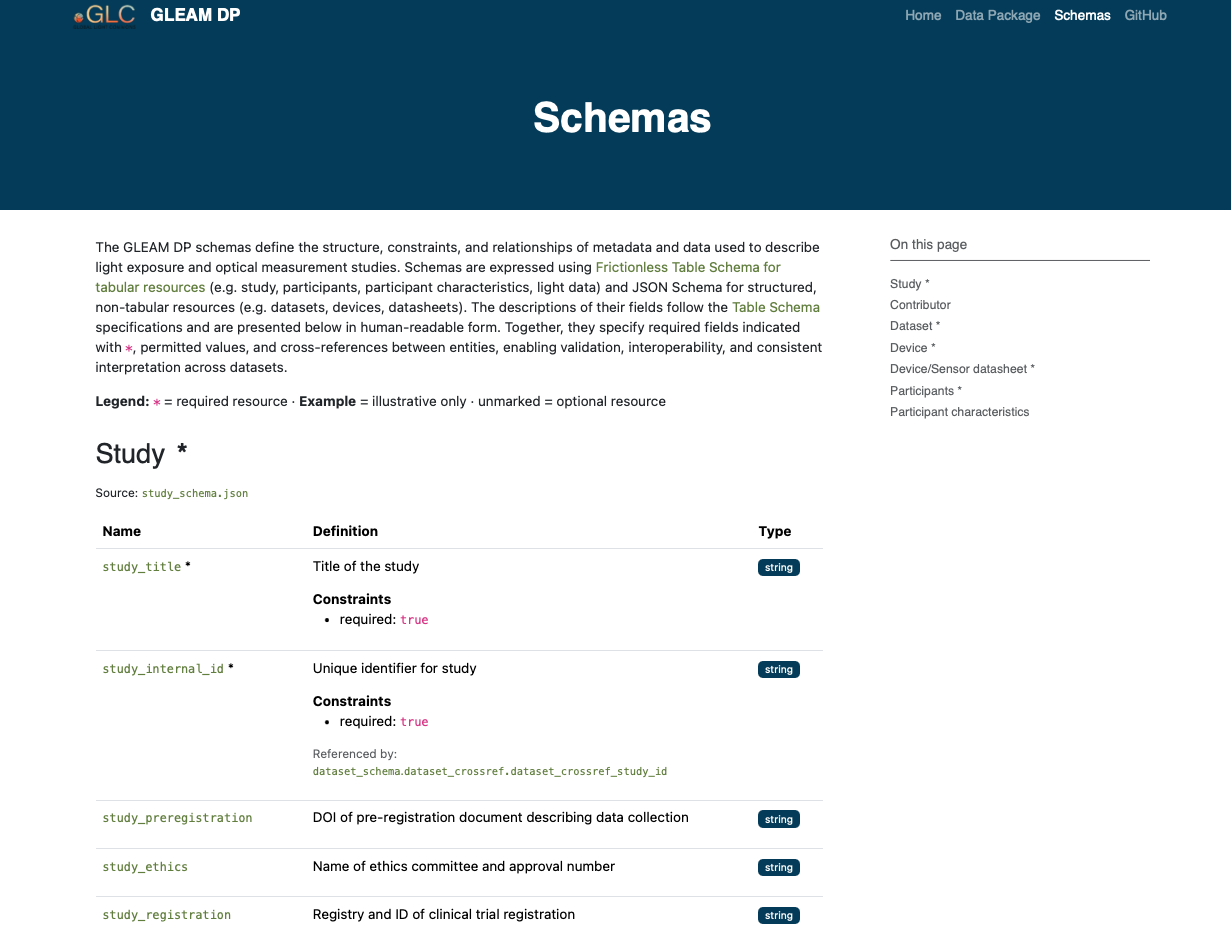
The Global Light Commons aims to support the sharing, discovery, and reuse of light exposure datasets through a common, metadata-driven framework. At its core are schemas, developed with community input, that provide structured, machine-readable descriptions of studies, devices, contributors, participants, and datasets. These schemas enable validation of datasets deposited in general-purpose repositories such as Zenodo, helping ensure that data are interpretable, comparable, and discoverable across studies. Rather than hosting data itself, the Commons is designed to index datasets that conform to these descriptions. A public schema viewer makes the structure of the model visible, allowing researchers to inspect and understand the schema.
Collaborative Insights
We have been privileged to welcome researchers, government representatives, NGOs, and thought leaders to the table. Together, we’ve explored what sustainable data collection looks like, how to ensure a collective legacy, and the best ways to integrate with existing frameworks.
While we are often working toward different specific outcomes, these conversations have unearthed some shared truths felt throughout our community:
- The constant pressure to “publish or perish.”
- Existing workflows that unfortunately do not prioritize data upload or open publication.
These discussions have also underscored the importance of building a community of practice around light exposure data. Shared infrastructure alone is not sufficient: long-term sustainability and meaningful reuse depend on a critical mass of researchers who adopt common descriptions and norms around data sharing. Establishing this community is essential both for maintaining the infrastructure over time and for ensuring its relevance to ongoing research.
Join the Conversation
Each conversation grounds us in a shared vision for the future. We believe this infrastructure must be built with the community, not just for it.
We want to hear from you. If you have perspectives or experiences to share, please get in touch via the GLEE homepage.
Read more about the vision for the Global Light Commons here.
Subscribe & unsubscribe
You can subscribe to this newsletter (and unsubscribe) by visiting the LightLogR mailing list.
Cite
If you want to cite this newsletter, please do so as:
APA:
Zauner, J., Thalji, S., Tsukimori, E., & Spitschan, M. (2026, January). LightLogR newsletter (No. 02). https://doi.org/10.5281/zenodo.18267830
Harvard:
Zauner, J., Thalji, S., Tsukimori, E. & Spitschan, M. 2026. LightLogR Newsletter, no. 2, January. Available at: https://doi.org/10.5281/zenodo.18267830 (Published 20 January 2026).